
Value Stream Mapping
Many healthcare organizations use value stream mapping to identify areas for improvement and to develop strategies for maximizing efficiency. A value stream map (VSM) is a visualization tool that is used to map the steps of a process and identify areas that may be creating inefficiencies.1 Identified problems can then be addressed to improve an organization’s efficiency and performance.
Pharmacies execute a number of processes that can be improved upon, such as filling or refilling a prescription for a patient, conducting a comprehensive medication review (CMR), or delivering an order to a patient’s home. This module explores how value stream mapping can be used in pharmacies to make common processes more efficient.
The module is divided into four lessons. You can move through the lessons in any order, though a linear progression is recommended.
It will take approximately 30 minutes to complete this module. At the end, you should be able to:
- Define “value stream map” and explain why these maps are useful.
- Explain the meaning of the symbols appearing in a value stream map.
- Explain the difference between “value added” and “non-value added” actions.
- Identify the types of waste commonly found in organizations.
- Describe ways in which value stream mapping supports quality improvement.
- Create a value stream map for a process in your pharmacy.
Select a lesson from the navigation menu at the top of your screen, or simply scroll down to proceed.
Introduction
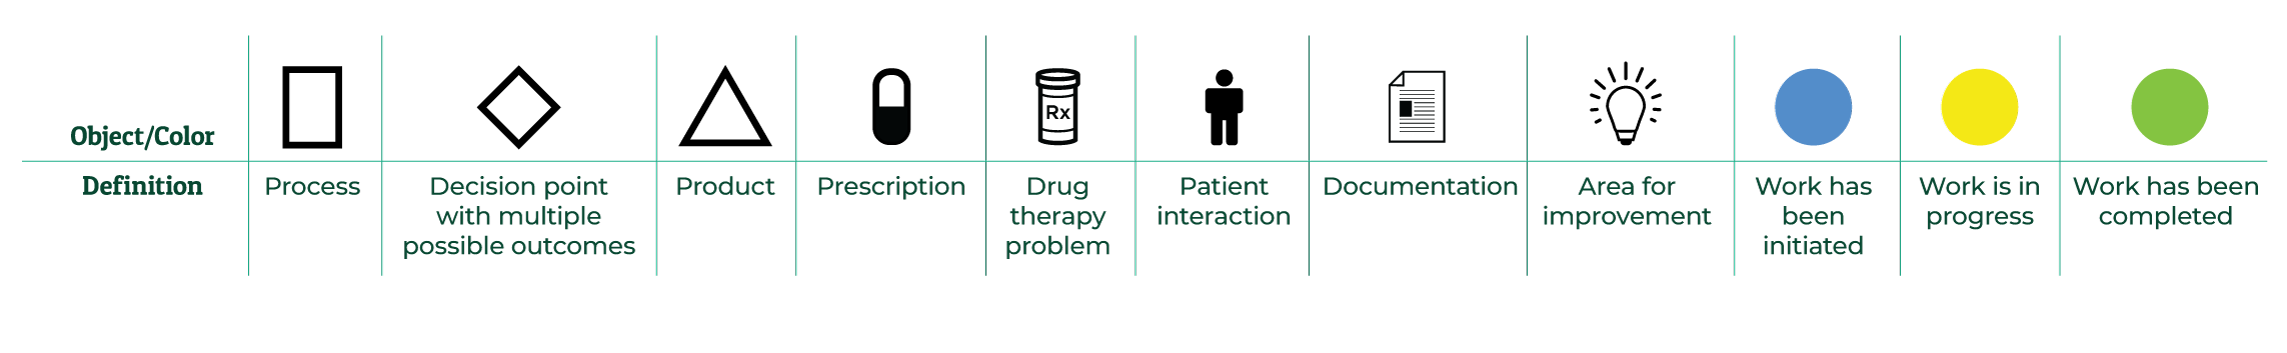
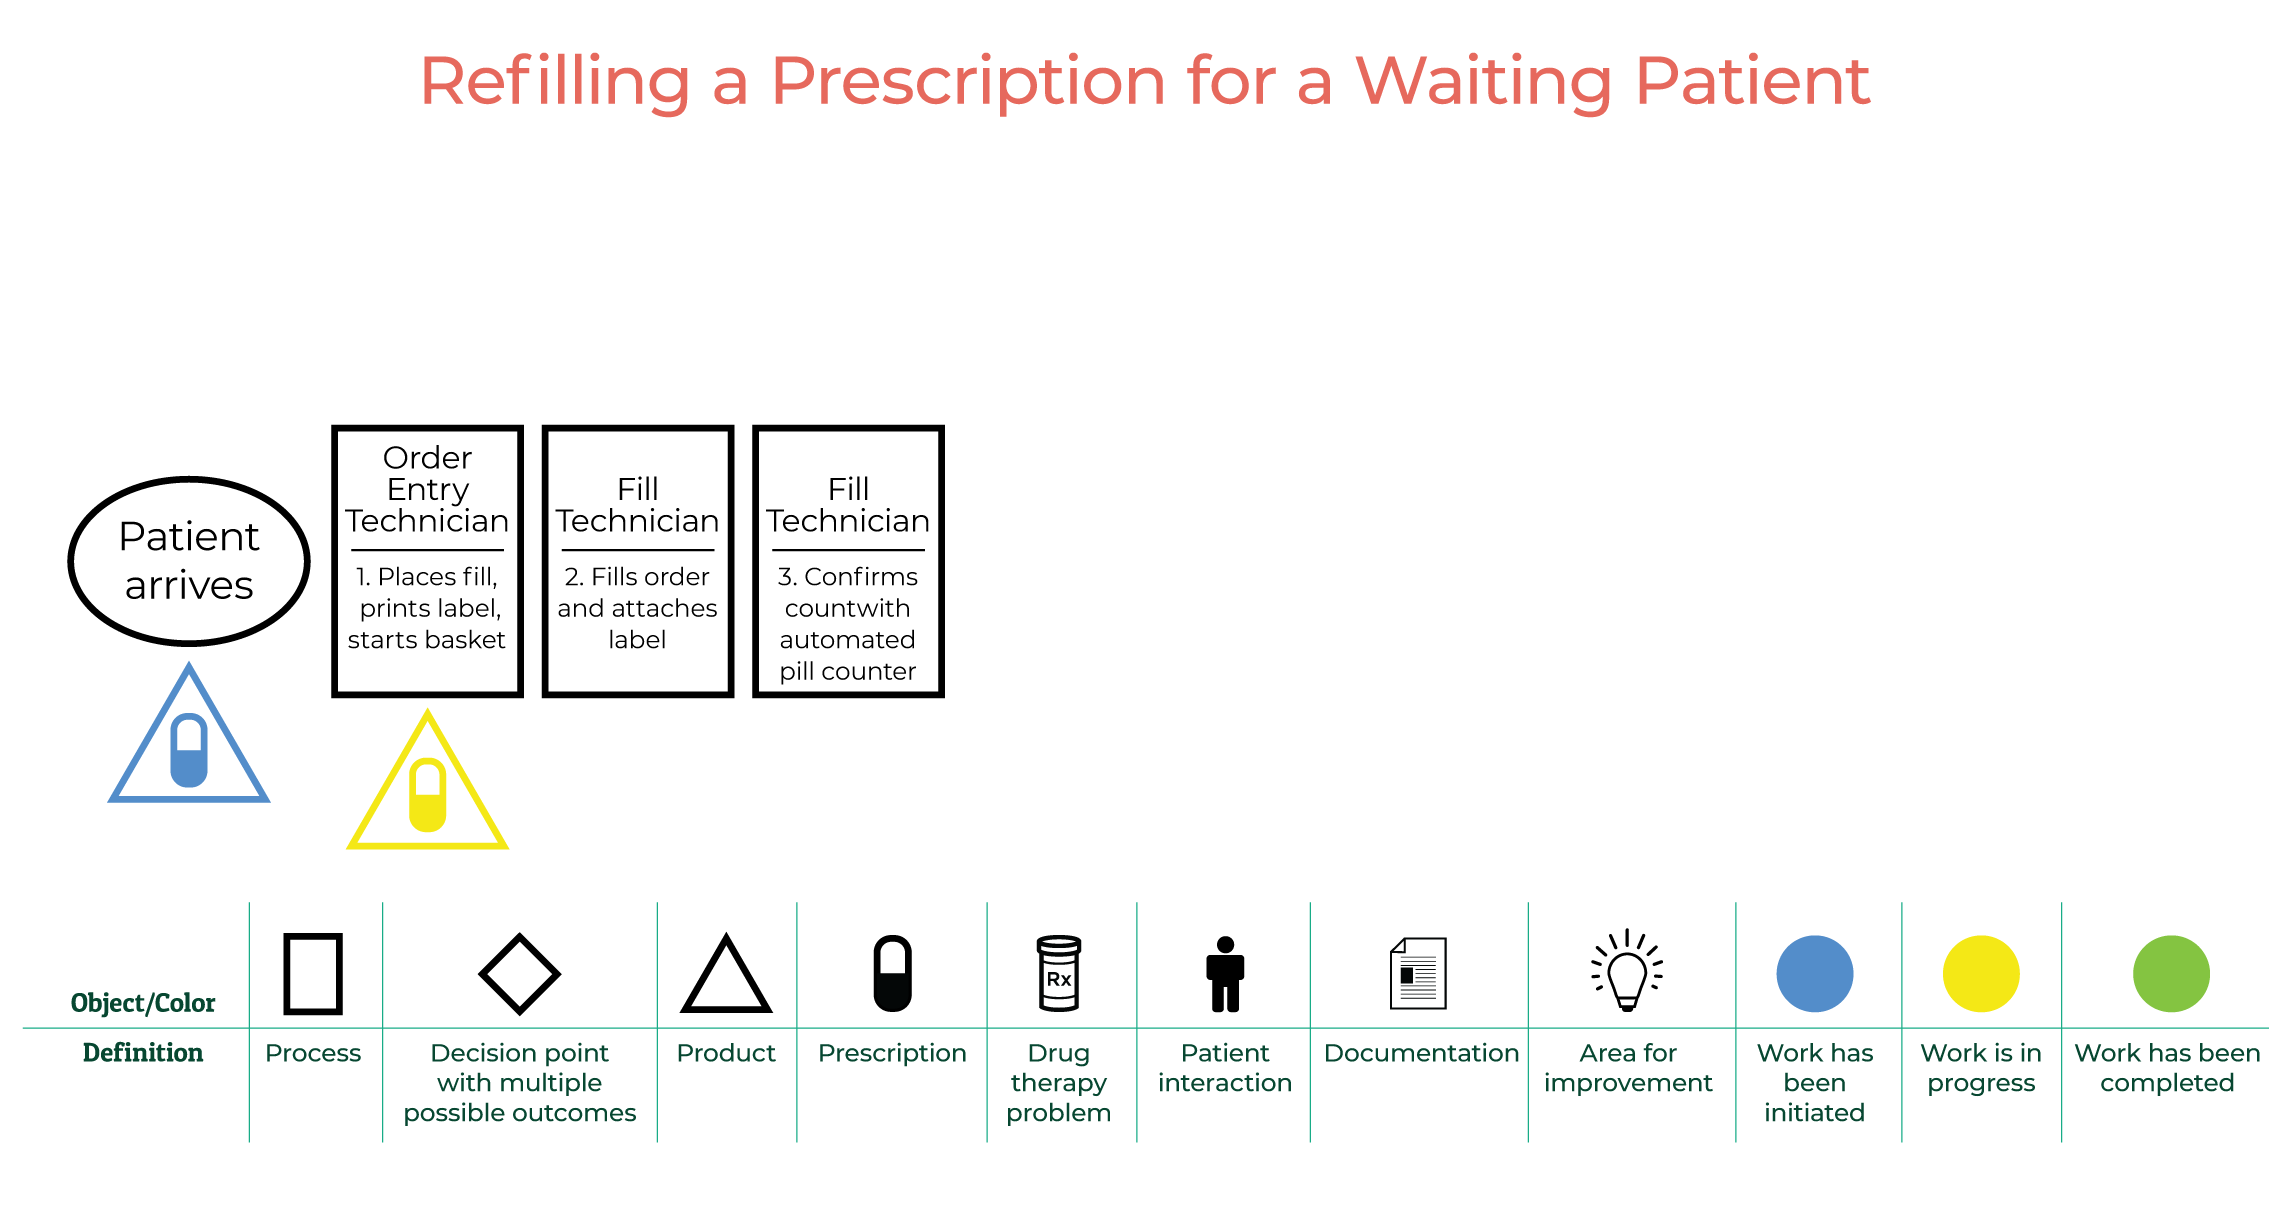
A value stream map is a flowchart of a process, where every step of the process is represented by a symbol that has a particular meaning.
- A rectangle represents a step in a process.
- A diamond identifies a decision point that has multiple possible outcomes.
- A triangle represents product.
Other symbols are used to represent the resources associated with a step in the process.
- A capsule corresponds to a prescription.
- A pill bottle signifies a drug therapy problem.
- The silhouette of a person represents a patient interaction.
- A document identifies documentation.
- A light bulb illuminates areas for improvement.
And finally, colors are used to signify degrees of completion of a step.
- Blue signifies that work has been initiated.
- Yellow means that work is in progress.
- Green identifies work that has been completed.
The purpose of creating a value stream map is to document how an organization manages everyday processes. This information can be used to determine if steps within those processes can be improved or made more efficient.
Example
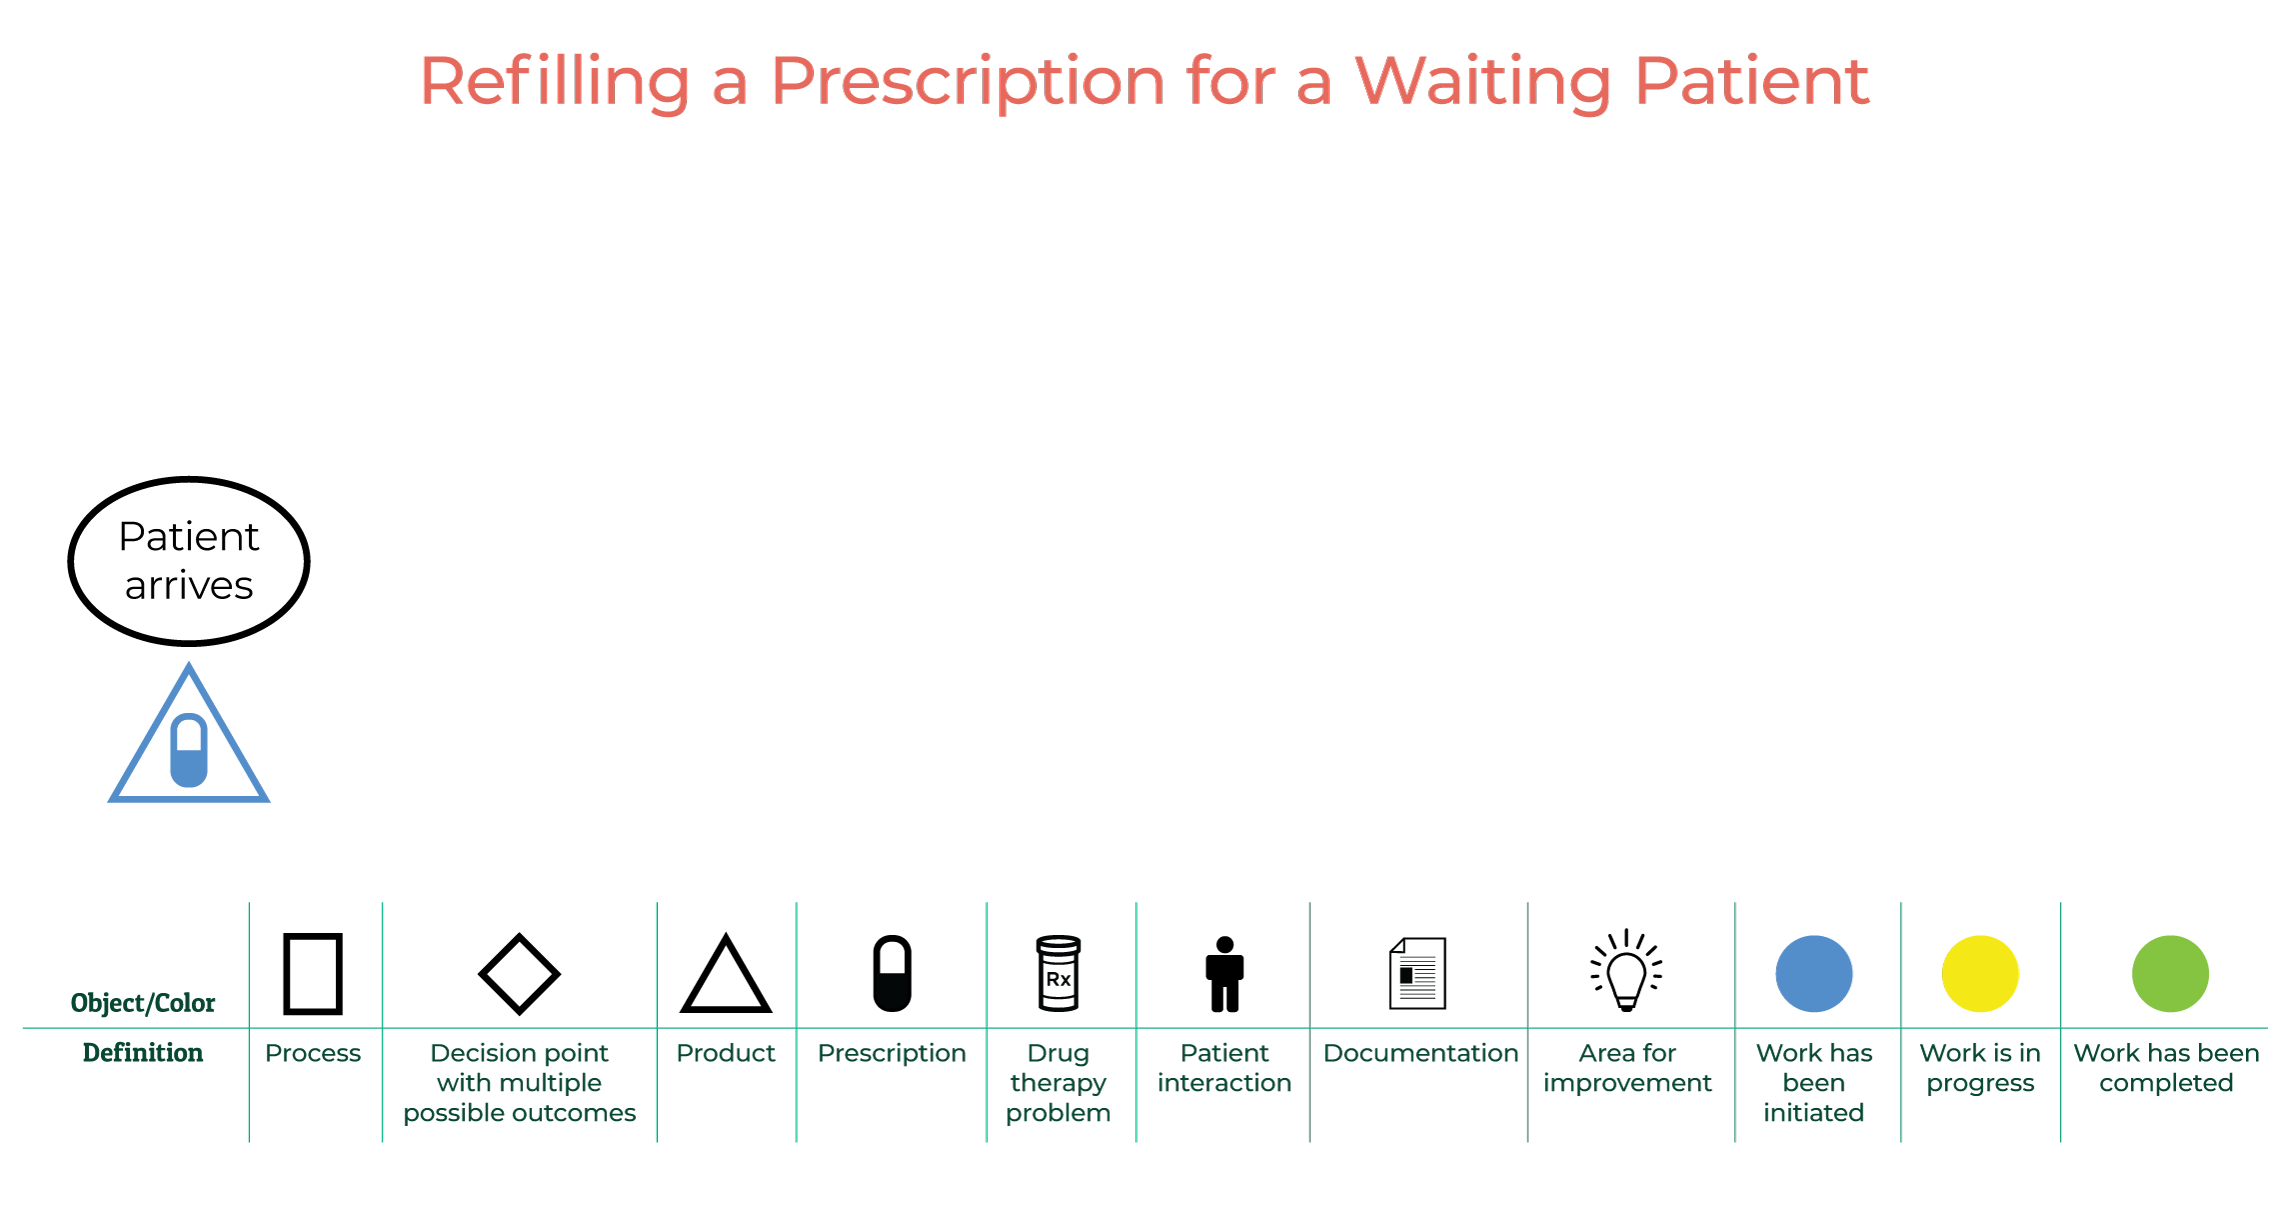
Let’s see how this process works. We will create a value stream map for a familiar task—refilling a prescription for a waiting patient.
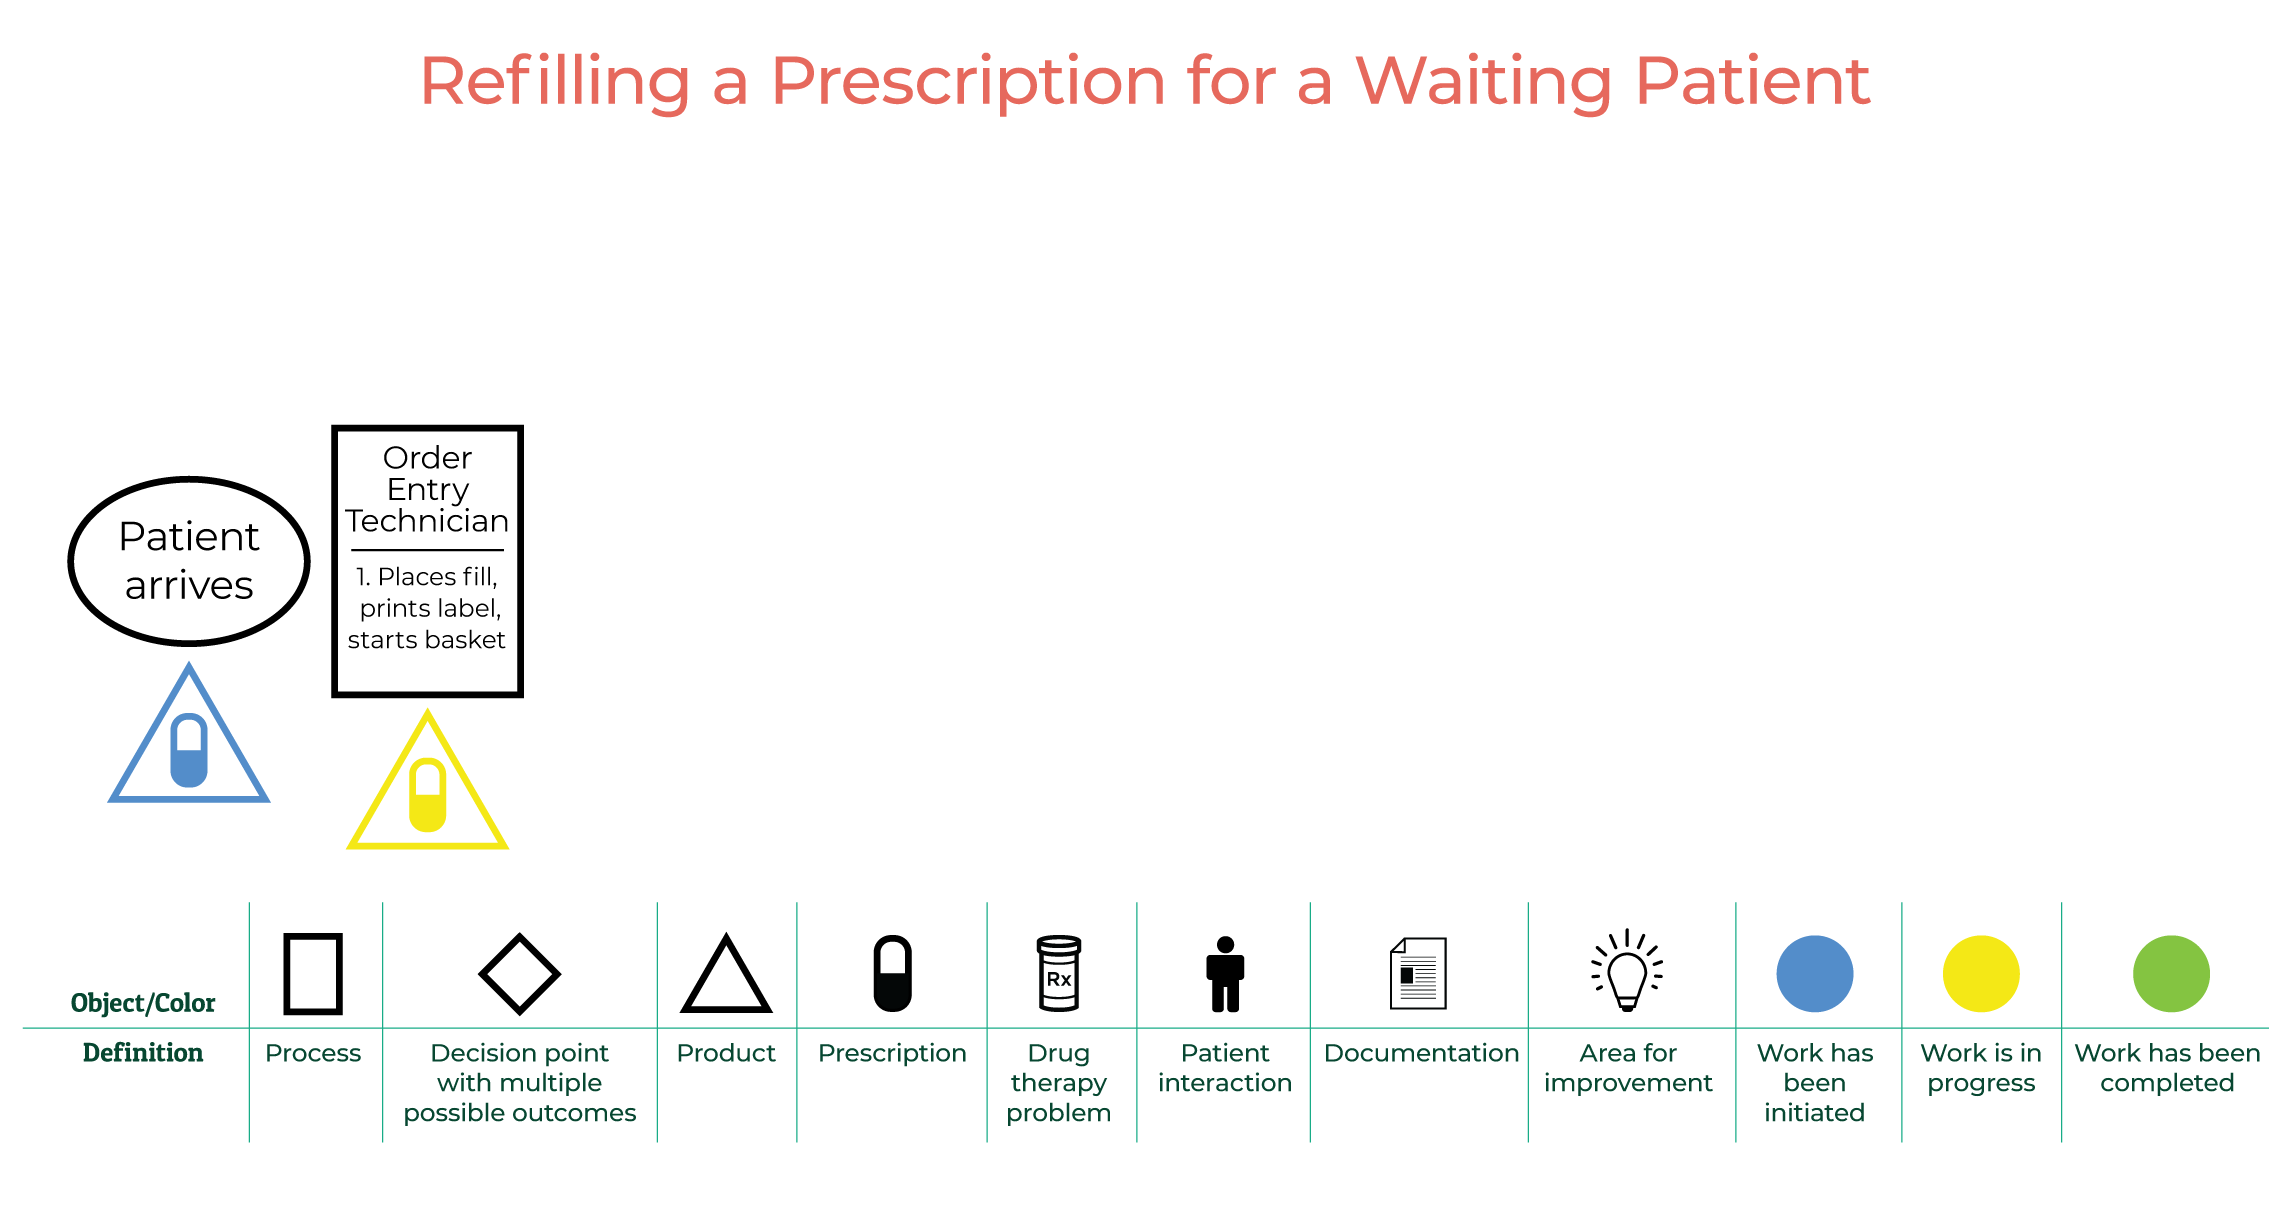
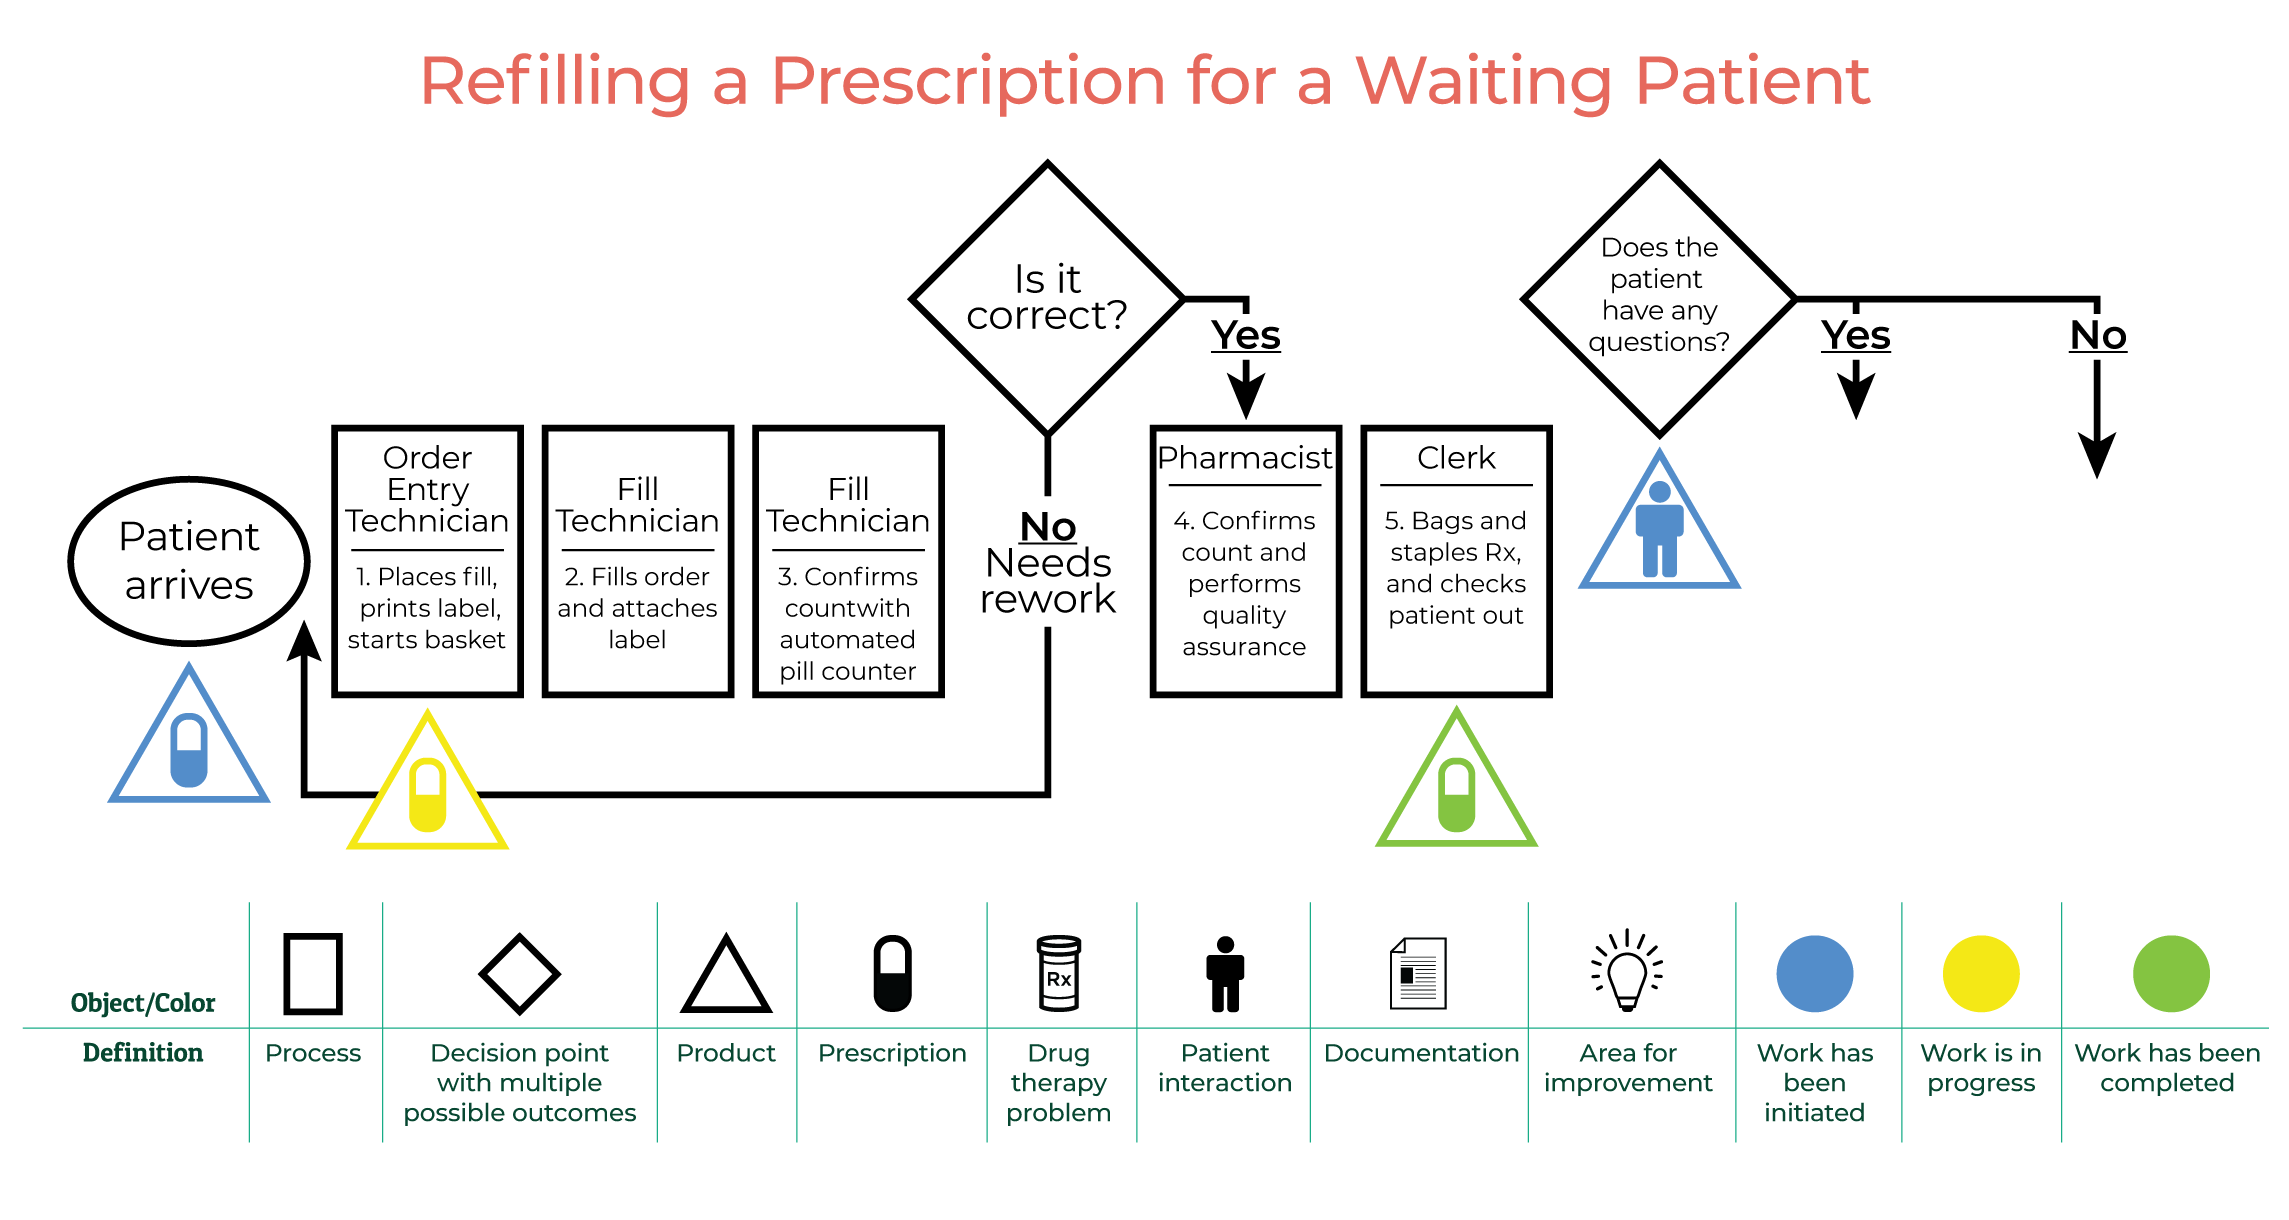
The process of refilling a prescription begins with the arrival of a patient, who gives the prescription number to the order entry technician. This step is represented by a triangle on our value stream map, signifying that work involving product has begun. The pill represents a prescription, and the color blue indicates that work has been initiated.
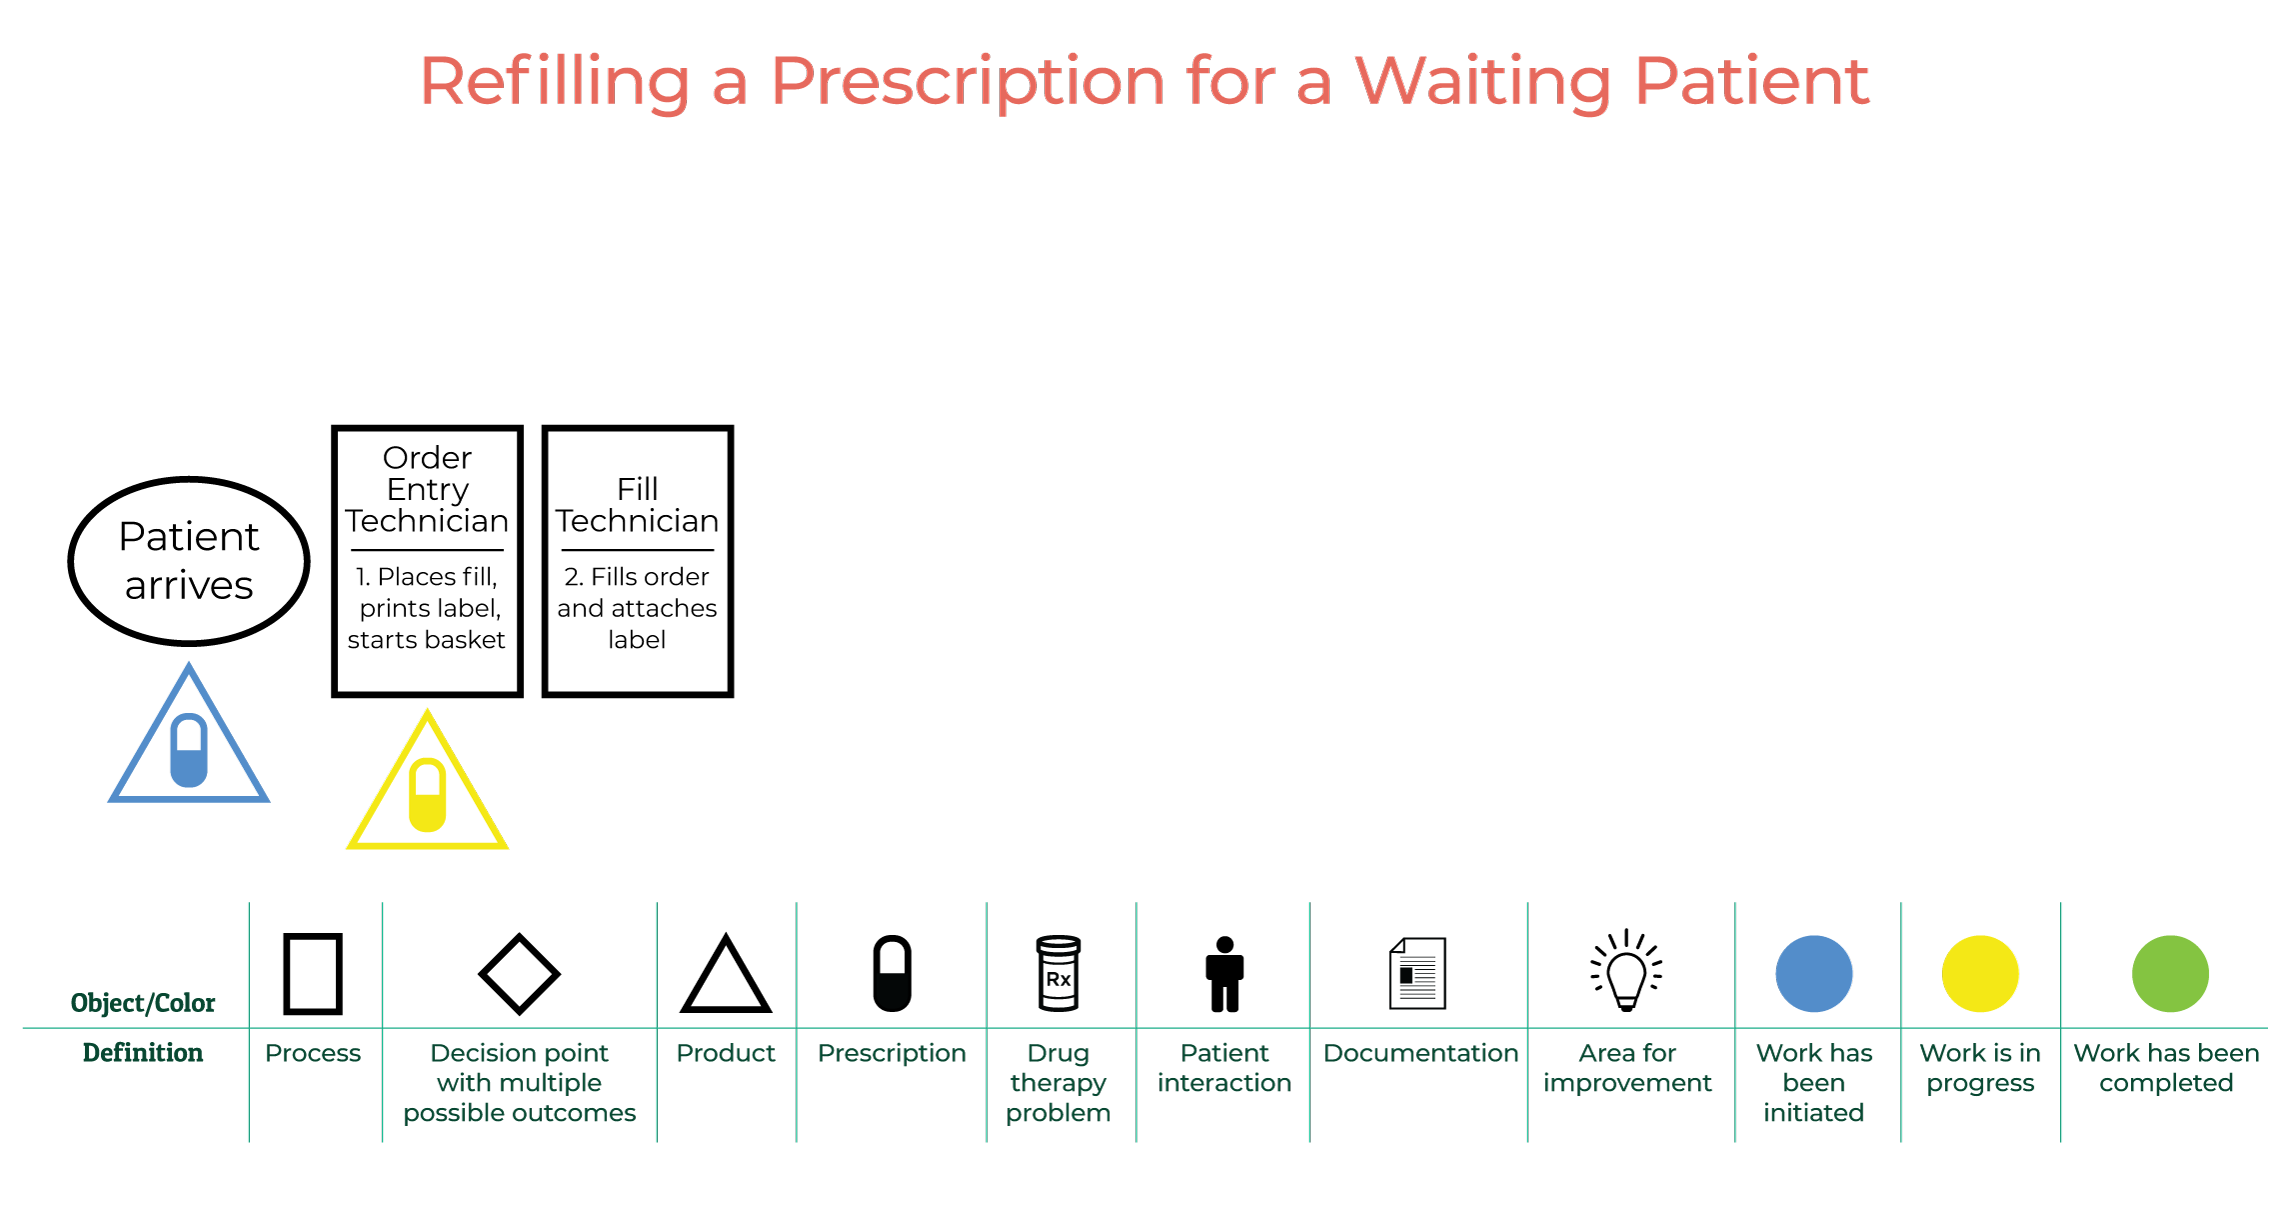
The order entry technician enters the order into the computer and prints a label. A rectangle is added to the value stream map to identify this step. The triangle—and the color yellow—indicate that work involving product is in progress.
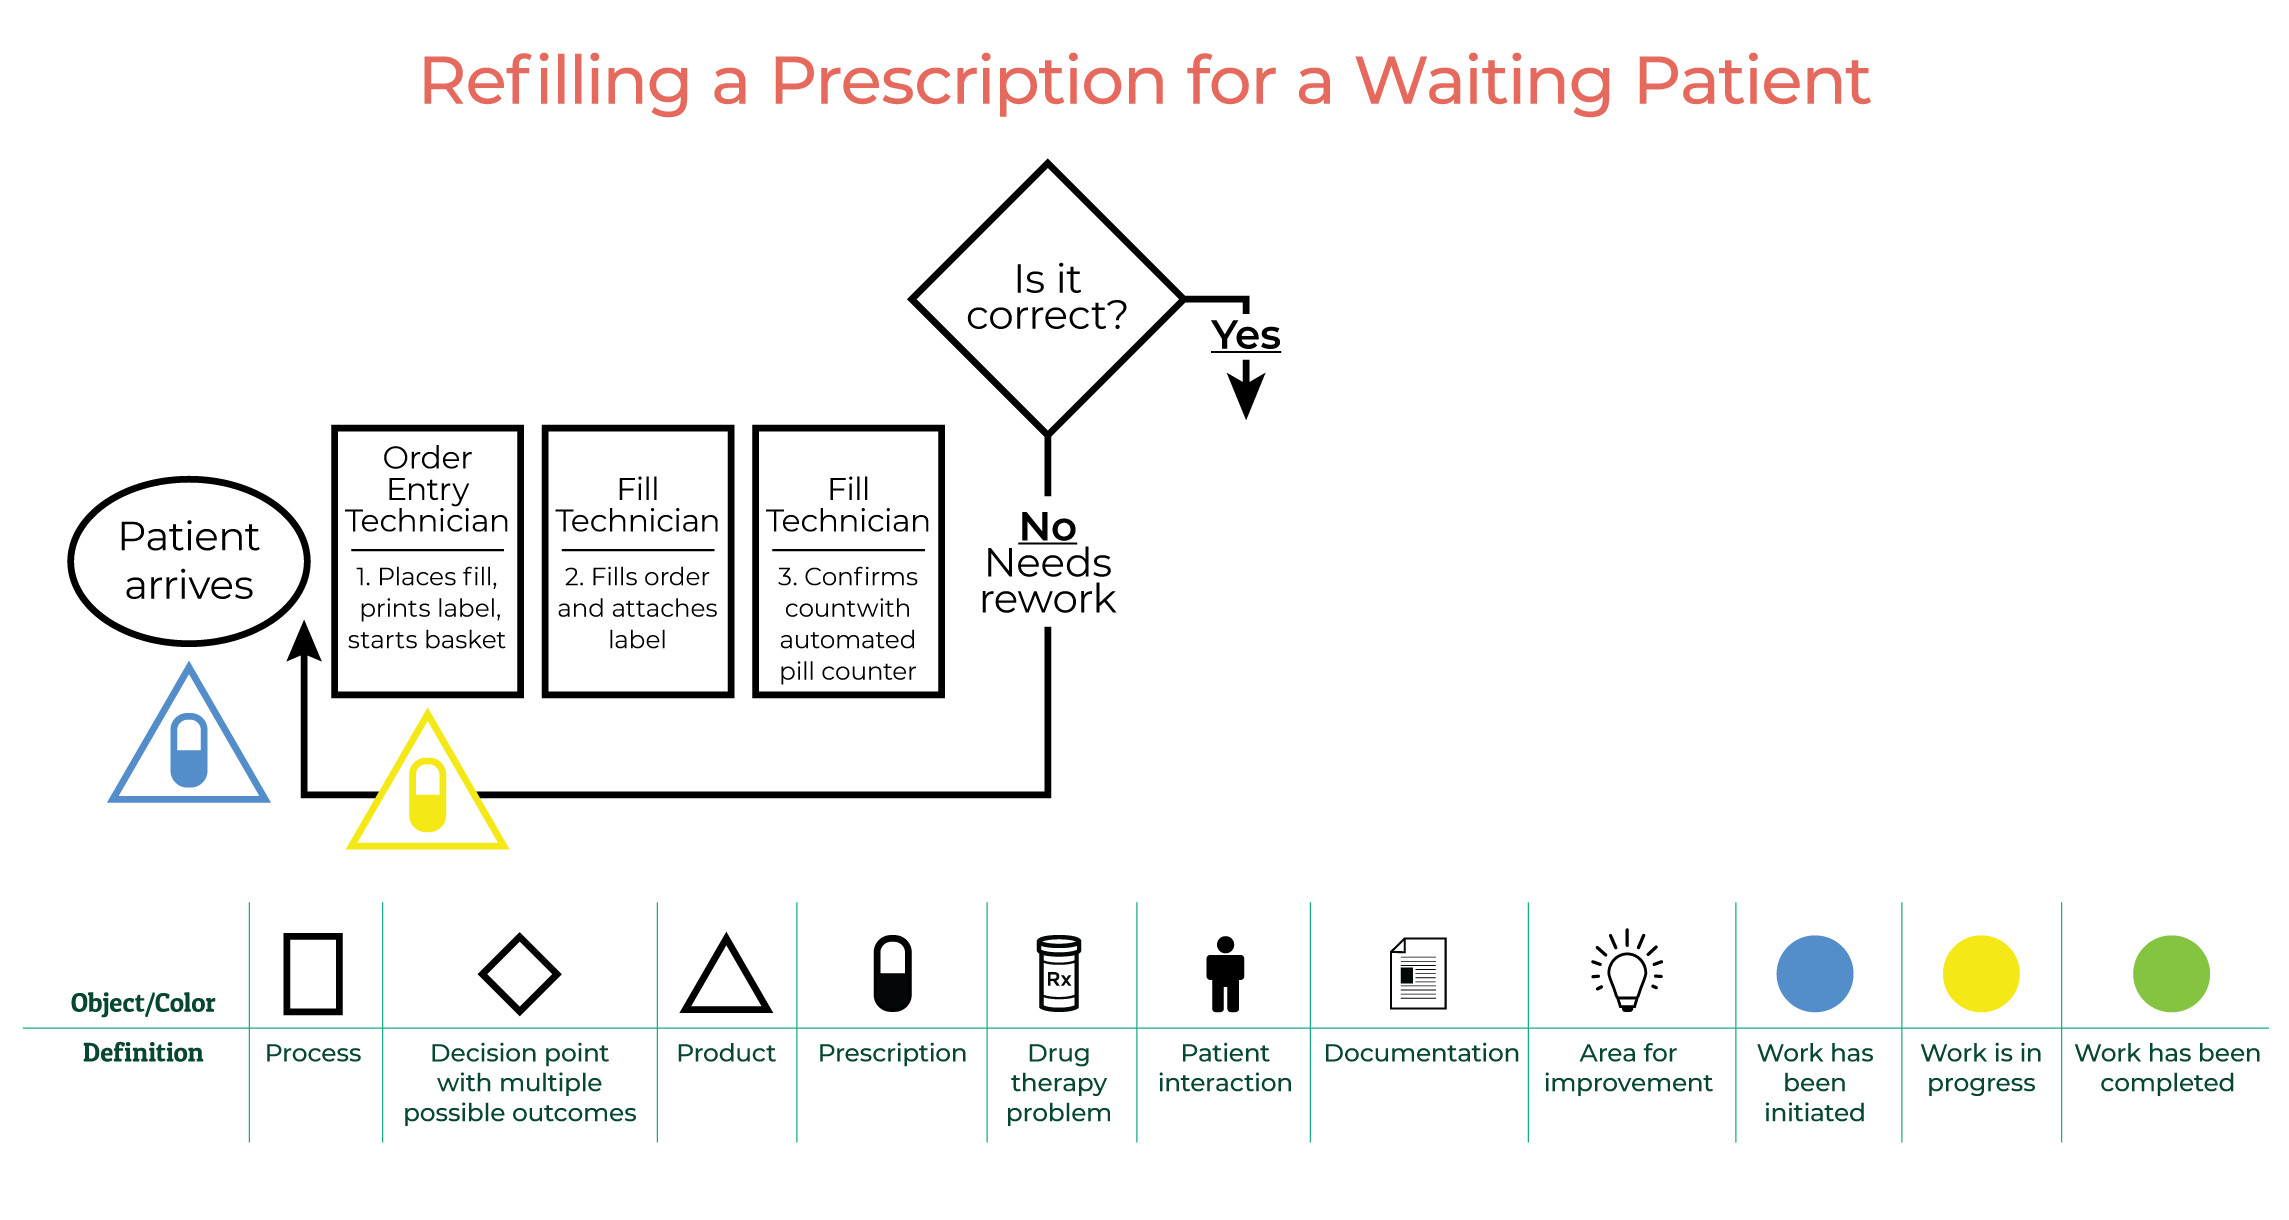
A fill technician fills the order and attaches a label. The value stream map reflects this action with a rectangle.
The fill technician then confirms the count with an automated pill counter. Again, a rectangle is added to the value stream map.
If the prescription has been filled correctly, the process continues. If there are errors, the prescription is rerouted to the order entry technician, and the process begins again. Notice that a diamond is used to signify a decision point—in this case, whether the prescription has been filled correctly or not.
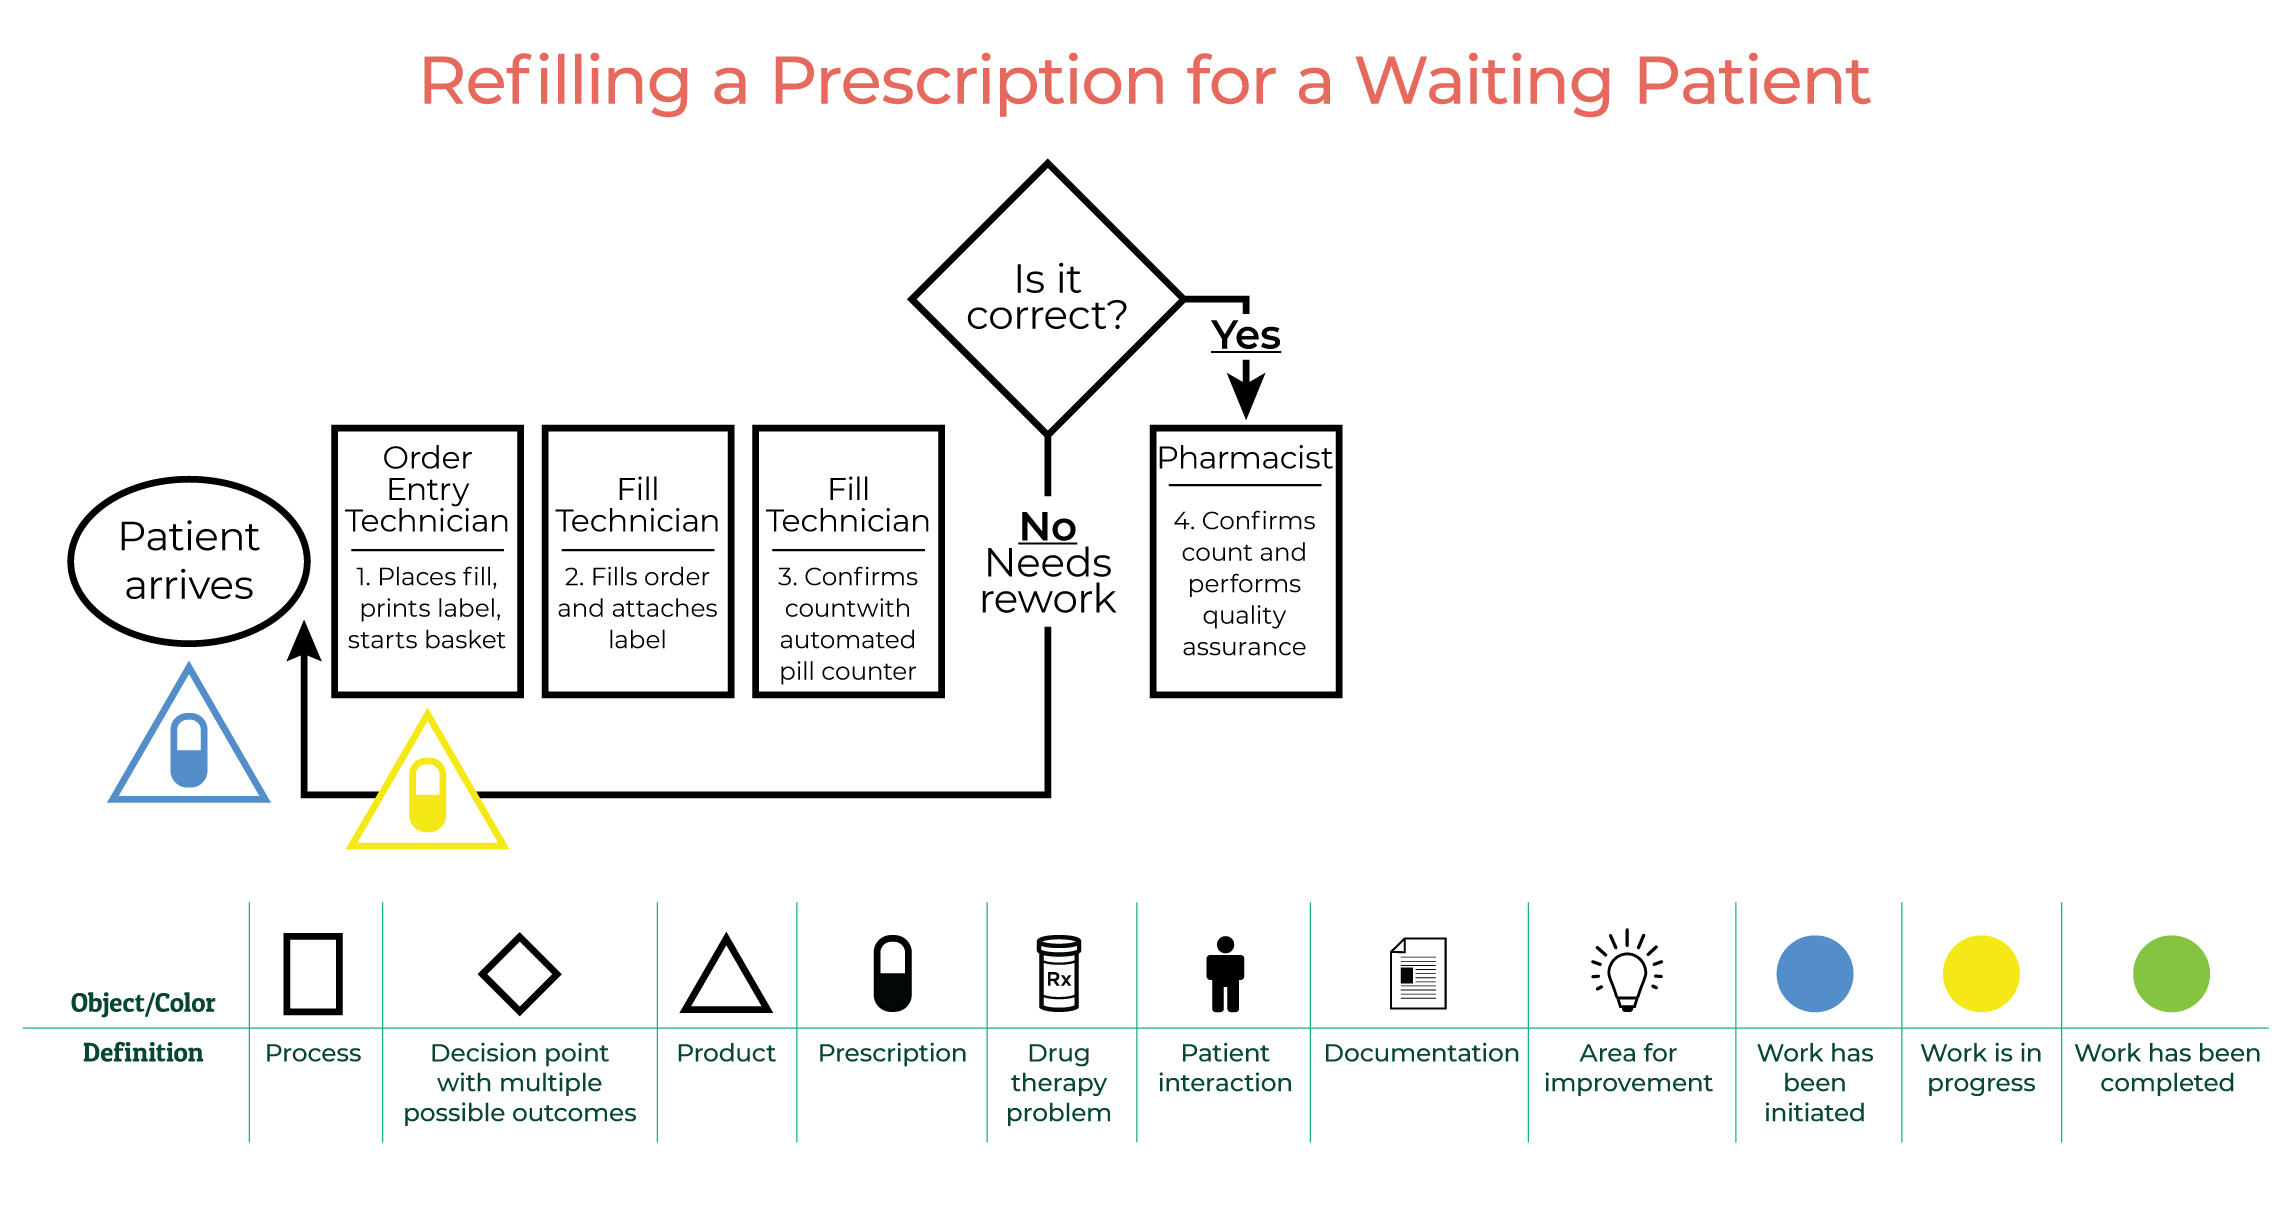
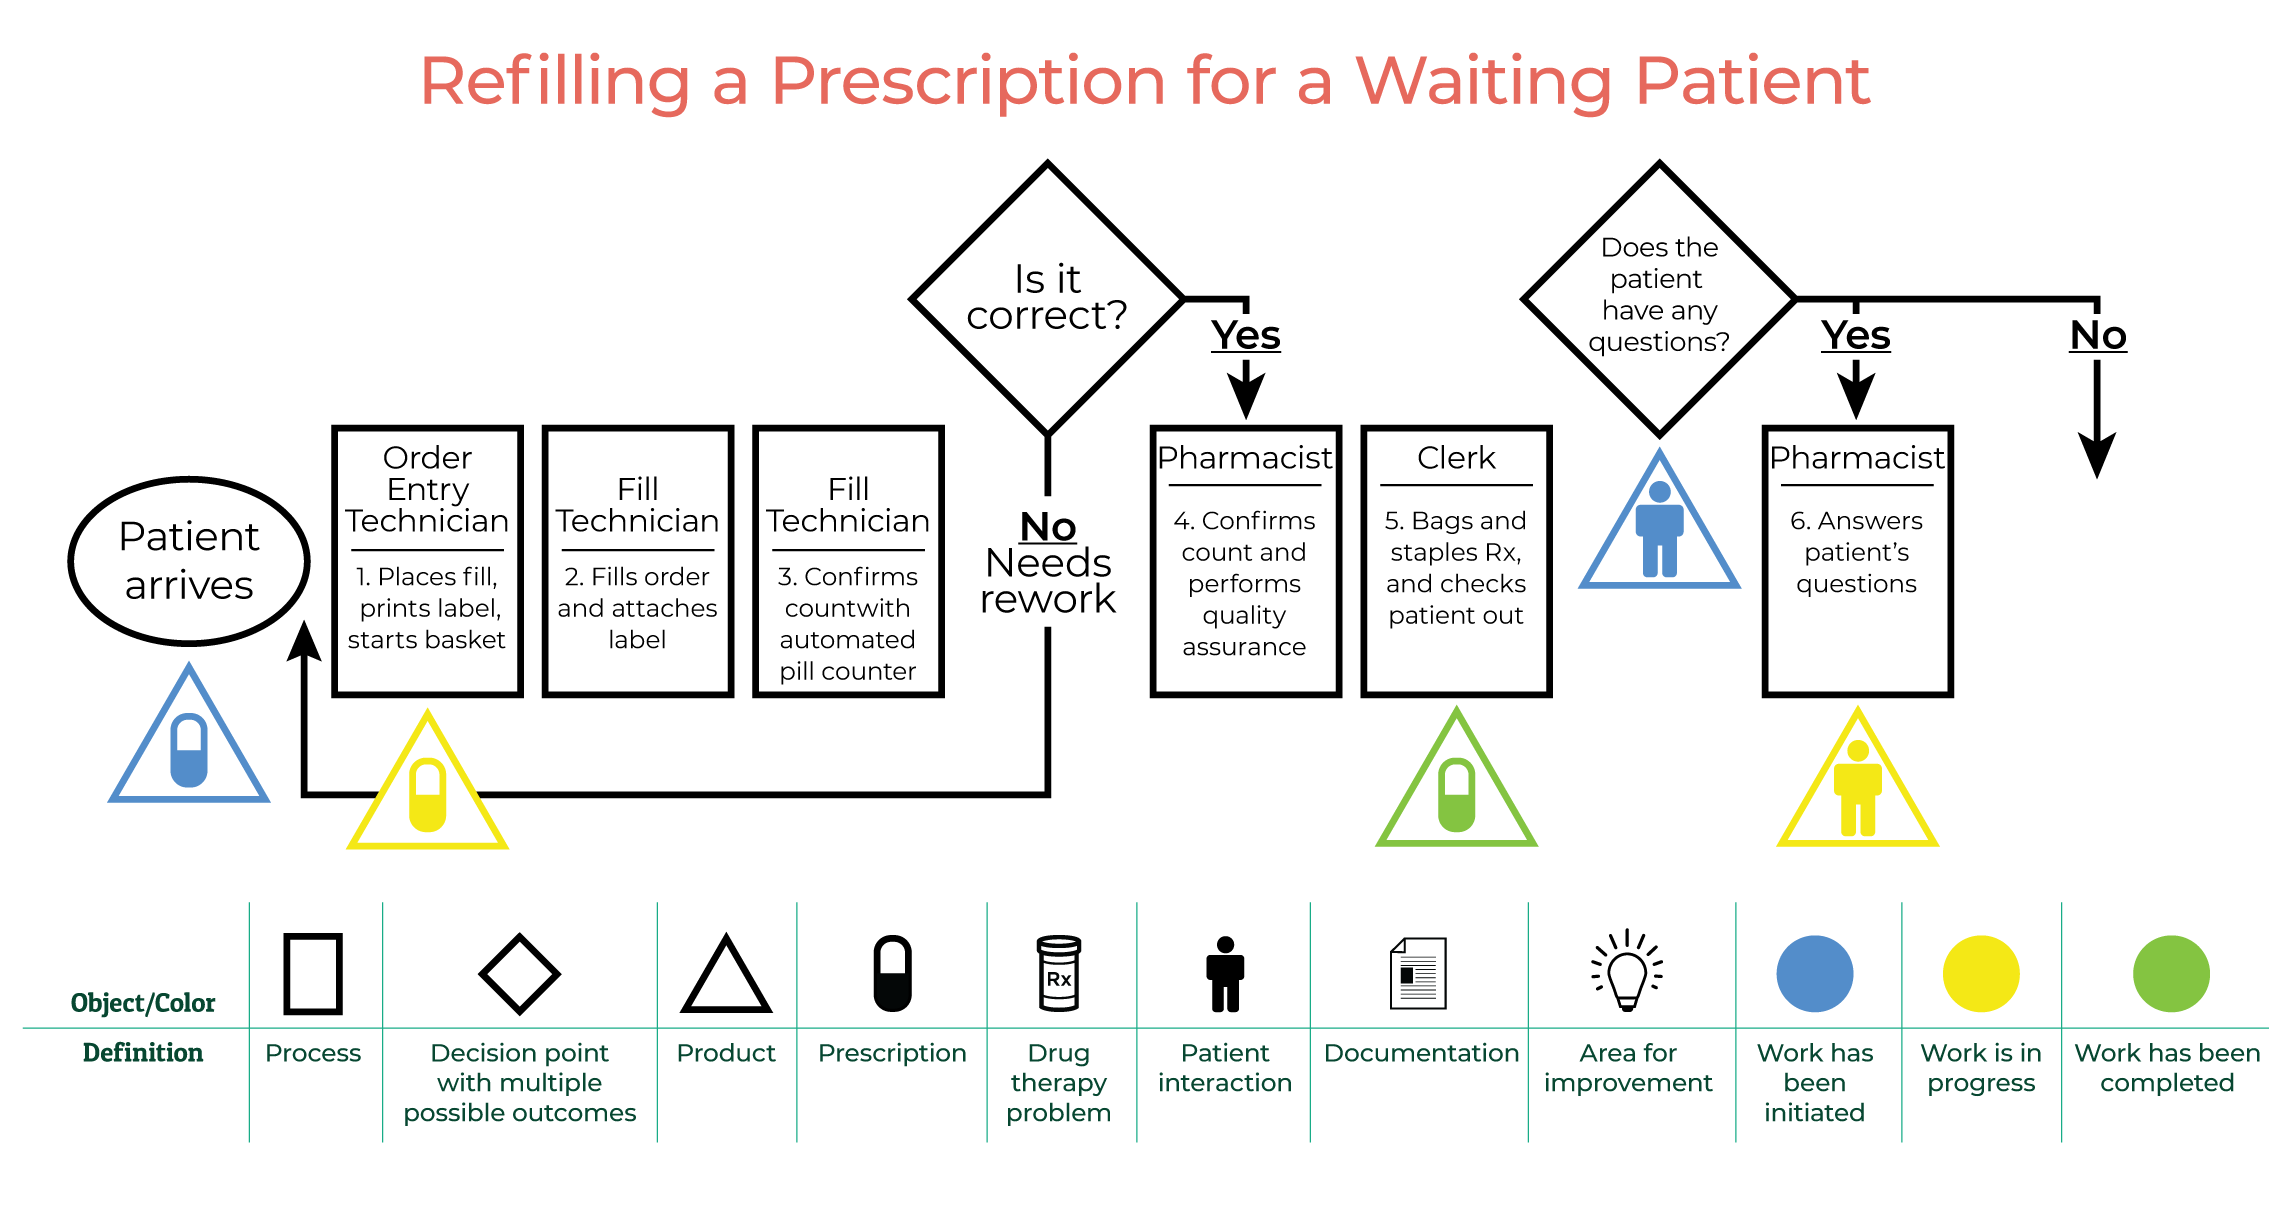
Assuming that everything is correct, the pharmacist confirms that the correct medication is in the bottle. The pharmacist also evaluates whether the medication is appropriate, safe, and effective for the patient. A corresponding rectangle is added to the value stream map.
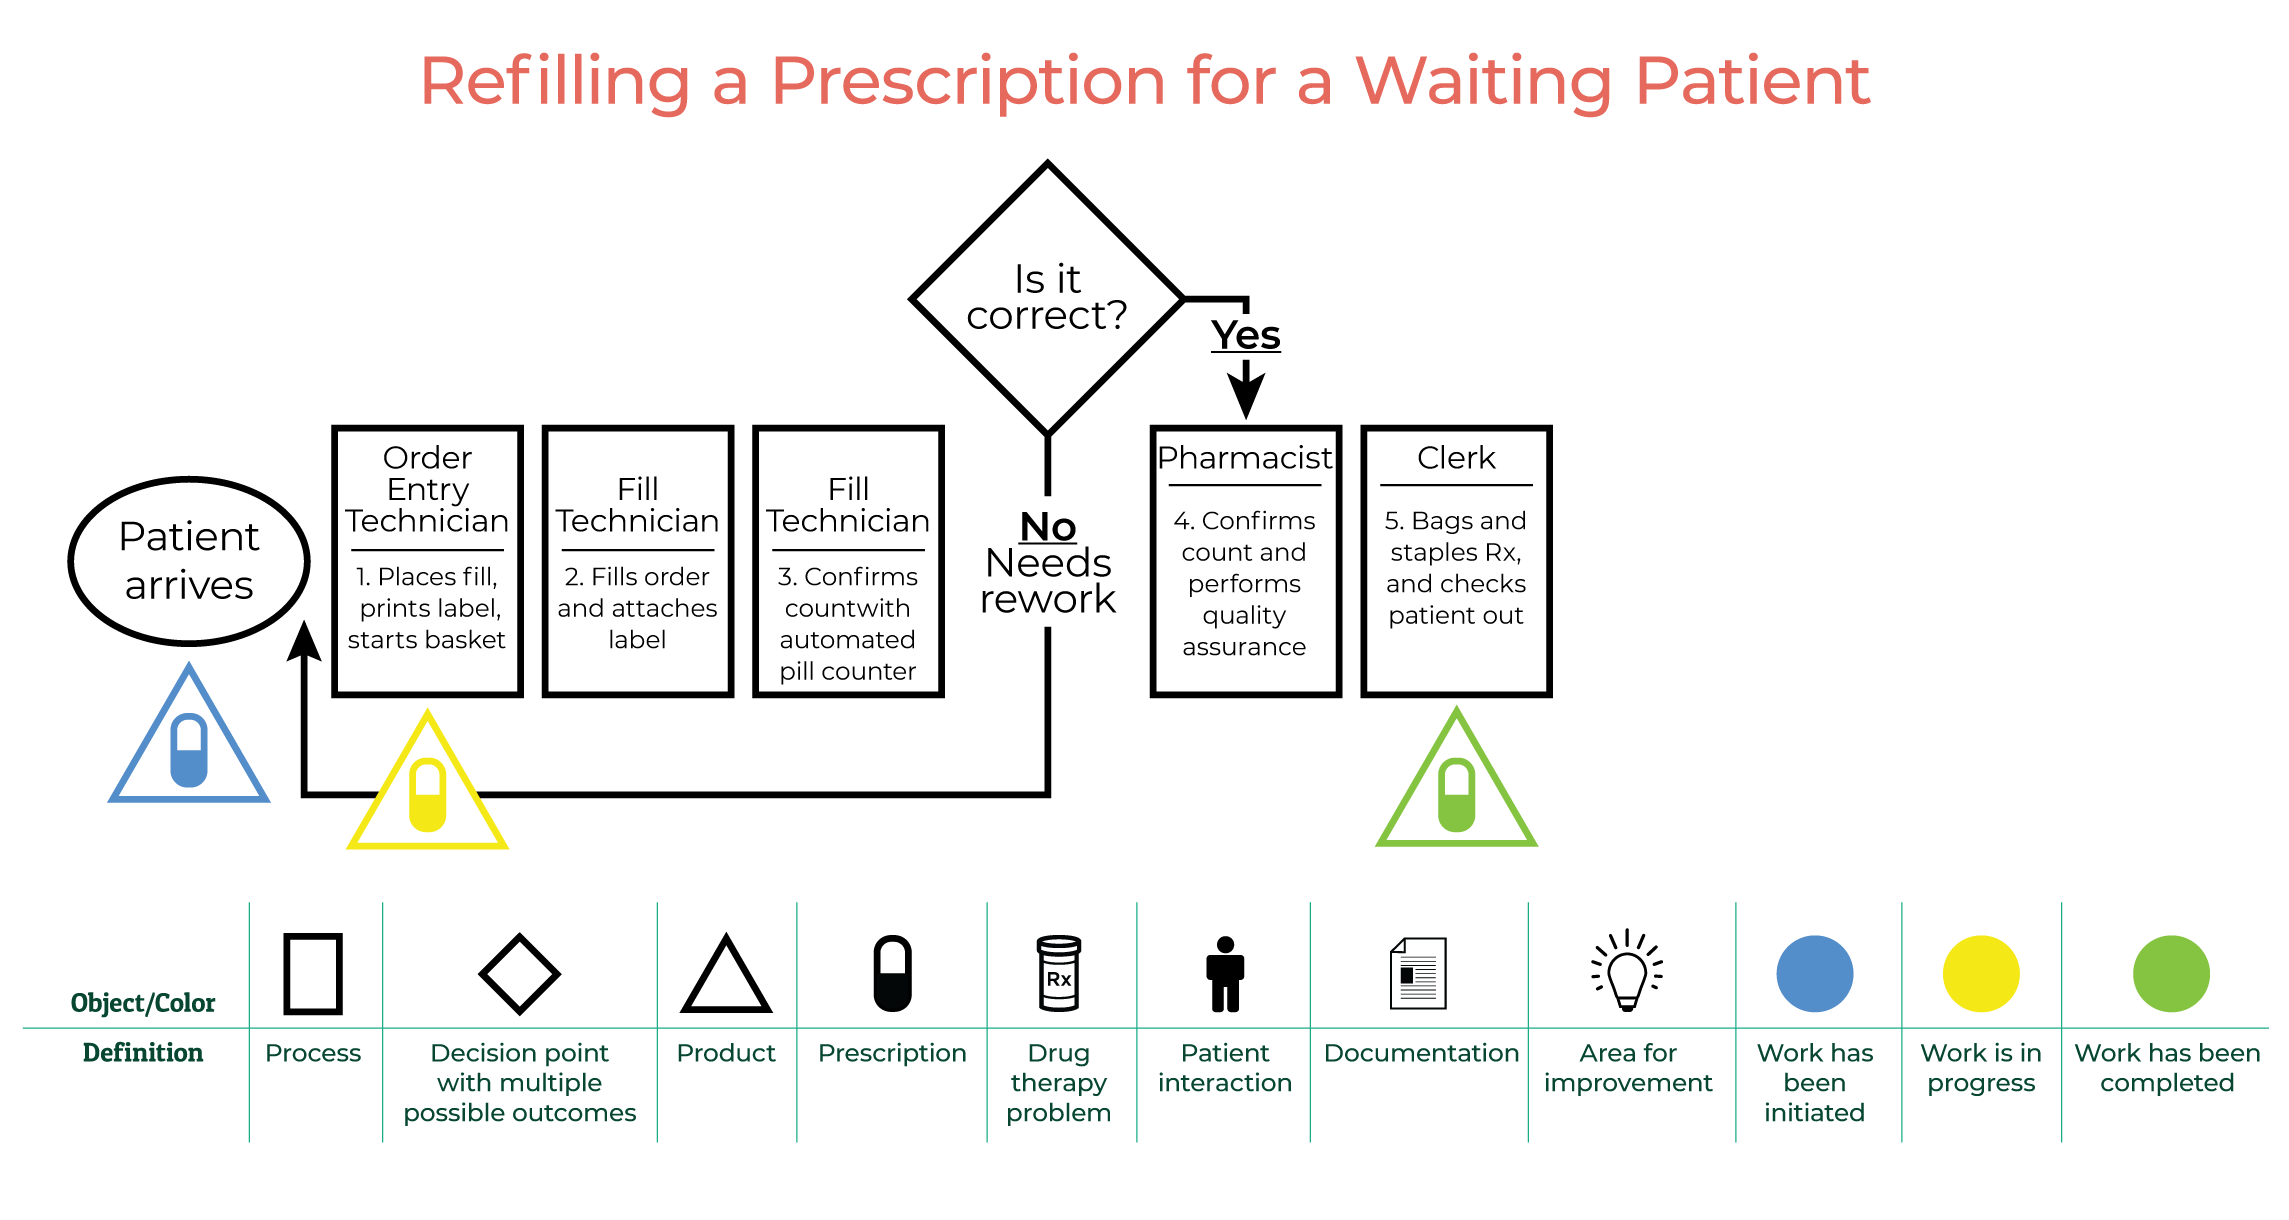
A staff member bags and staples the prescription, and then checks out the patient. The green pill inside the triangle signifies that work involving product is complete.
The staff member asks if the patient has any questions. Notice the diamond on the value stream map, which identifies a decision point. The silhouette of a person indicates a patient interaction, and the color blue means that work has been initiated.
If the patient does have questions, then the pharmacist is summoned for a consultation. This step is represented by a rectangle. The triangle indicates that product is involved. The silhouette of a person signifies a patient interaction, and the color yellow means that the work is in progress.
If the patient does not have any questions, then the patient departs. A triangle is added to represent product, the silhouette signifies a patient interaction, and the color green shows that work has been finished.
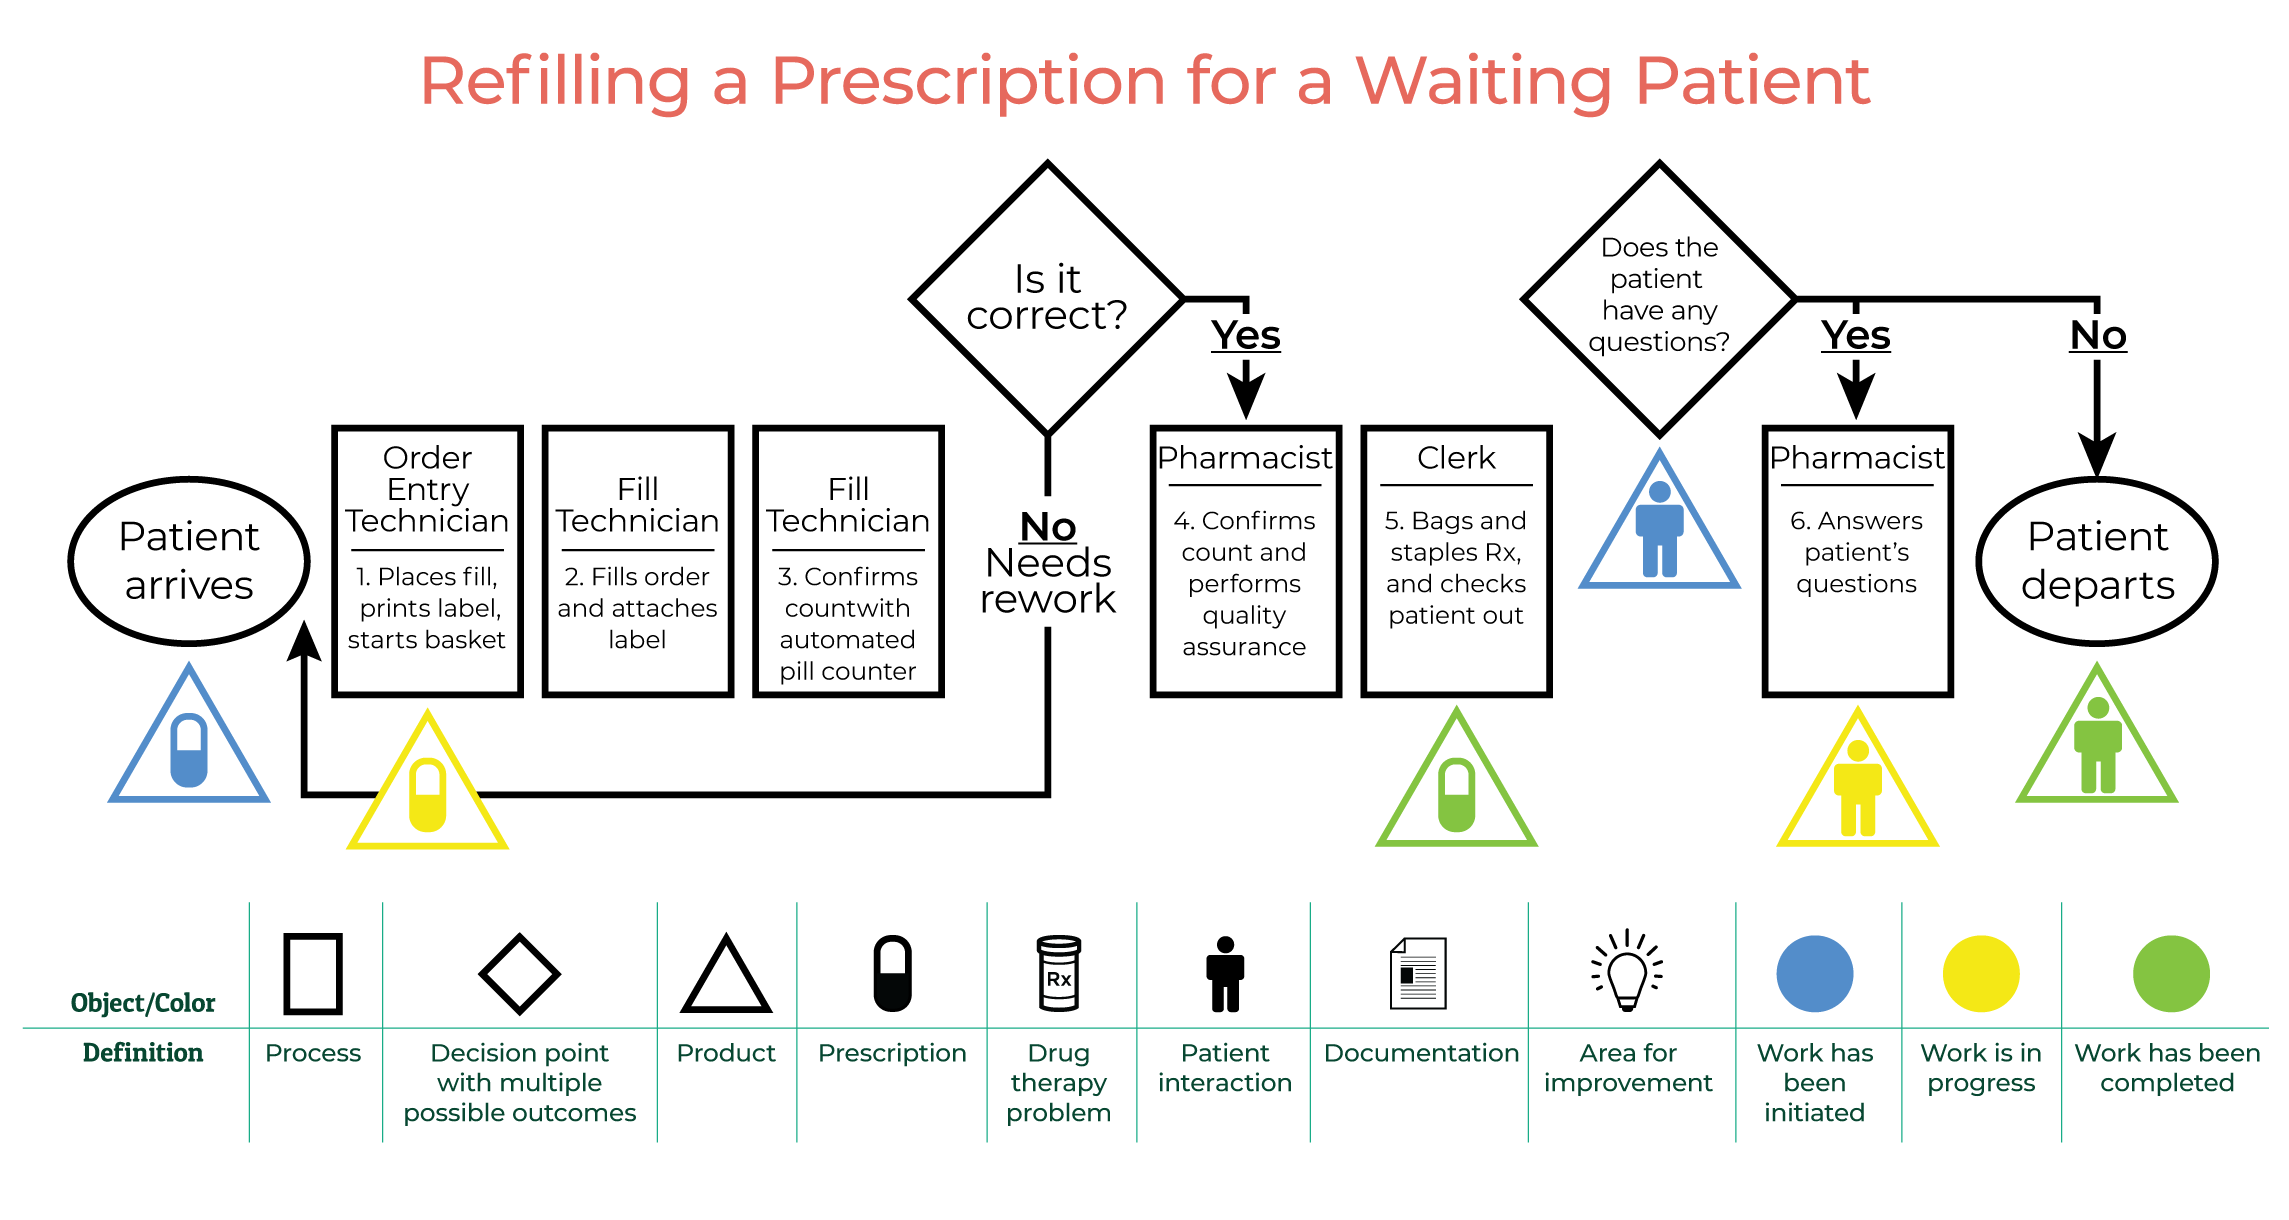
The value stream map is now complete, making it easy to visually identify each of the individual steps involved in the process of refilling a prescription for a waiting patient.
Check Your Knowledge
Question One
Symbols in value stream maps have specific meanings. What does a rectangle signify?
- Please select your answer.
- A) A step in the process
- B) A decision point
- C) An area for improvement
- D) A place where inventory is involved
Question Two
What does a triangle signify in a value stream map?
- Please select your answer.
- A) A step in the process
- B) A decision point
- C) An area for improvement
- D) A place where product (inventory) is involved
Question Three
Take a moment to study the value stream map provided. Which of the following statements about this value stream map is correct?

- Please select your answer.
- A) According to this flowchart, if errors are found in a filled prescription, it proceeds immediately to the pharmacist for correction.
- B) The green pill in Step 5 indicates that work on the prescription has been completed.
- C) The diamond accompanied by the blue silhouette means that a patient interaction is in progress.
- D) In this flowchart, the clerk bags the prescription and checks the patient out after asking if he/she has any questions.
Your answer is incorrect. If errors are found in a filled prescription, it returns to the order entry clerk for re-work.
The statement in option B is correct. Green signifies that work has been completed, and the pill represents a prescription. Taken together, the symbol means that work on the prescription has been completed.
Your answer is incorrect. The blue silhouette means that a patient interaction has been initiated; if the interaction were in progress, the silhouette would be yellow.
The statement in option B is correct. Green signifies that work has been completed, and the pill represents a prescription. Taken together, the symbol means that work on the prescription has been completed.
Your answer is incorrect. In this example, the clerk bags the prescription and checks out the patient BEFORE asking if he/she has questions.
The statement in option B is correct. Green signifies that work has been completed, and the pill represents a prescription. Taken together, the symbol means that work on the prescription has been completed.
Lesson Progress
Value Added and Non-Value Added Actions
Definitions
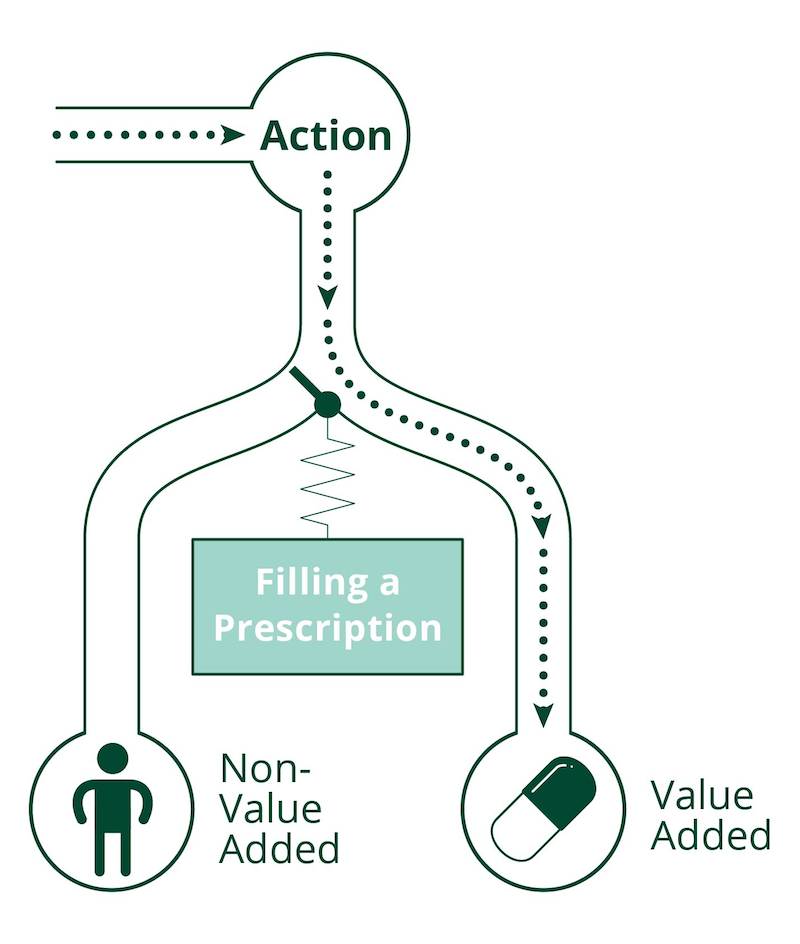
One of the key functions of value stream mapping is to identify areas within an organization that are inefficient. To do this, value stream maps identify actions within a process that are “value added” versus those that are “non-value added.”2
In healthcare, a value-added action is defined as any action or service that provides an improvement in care to a patient in some way. A non-value added action has the opposite effect.3
Comparison of Value Added and Non-Value Added Actions
| Definition | Examples | |
| Value Added | Action or service that provides an improvement to patient care | Filling a prescription correctly, counseling a patient |
| Non-Value Added | Action or service that does not provide any improvement in care and could be considered wasteful | Refilling a prescription due to a mistake, putting back a prescription that never got picked up |
Value streams
Consider the example of refilling a prescription for a waiting patient that appeared in the Introduction. A value stream map for this process is shown below.
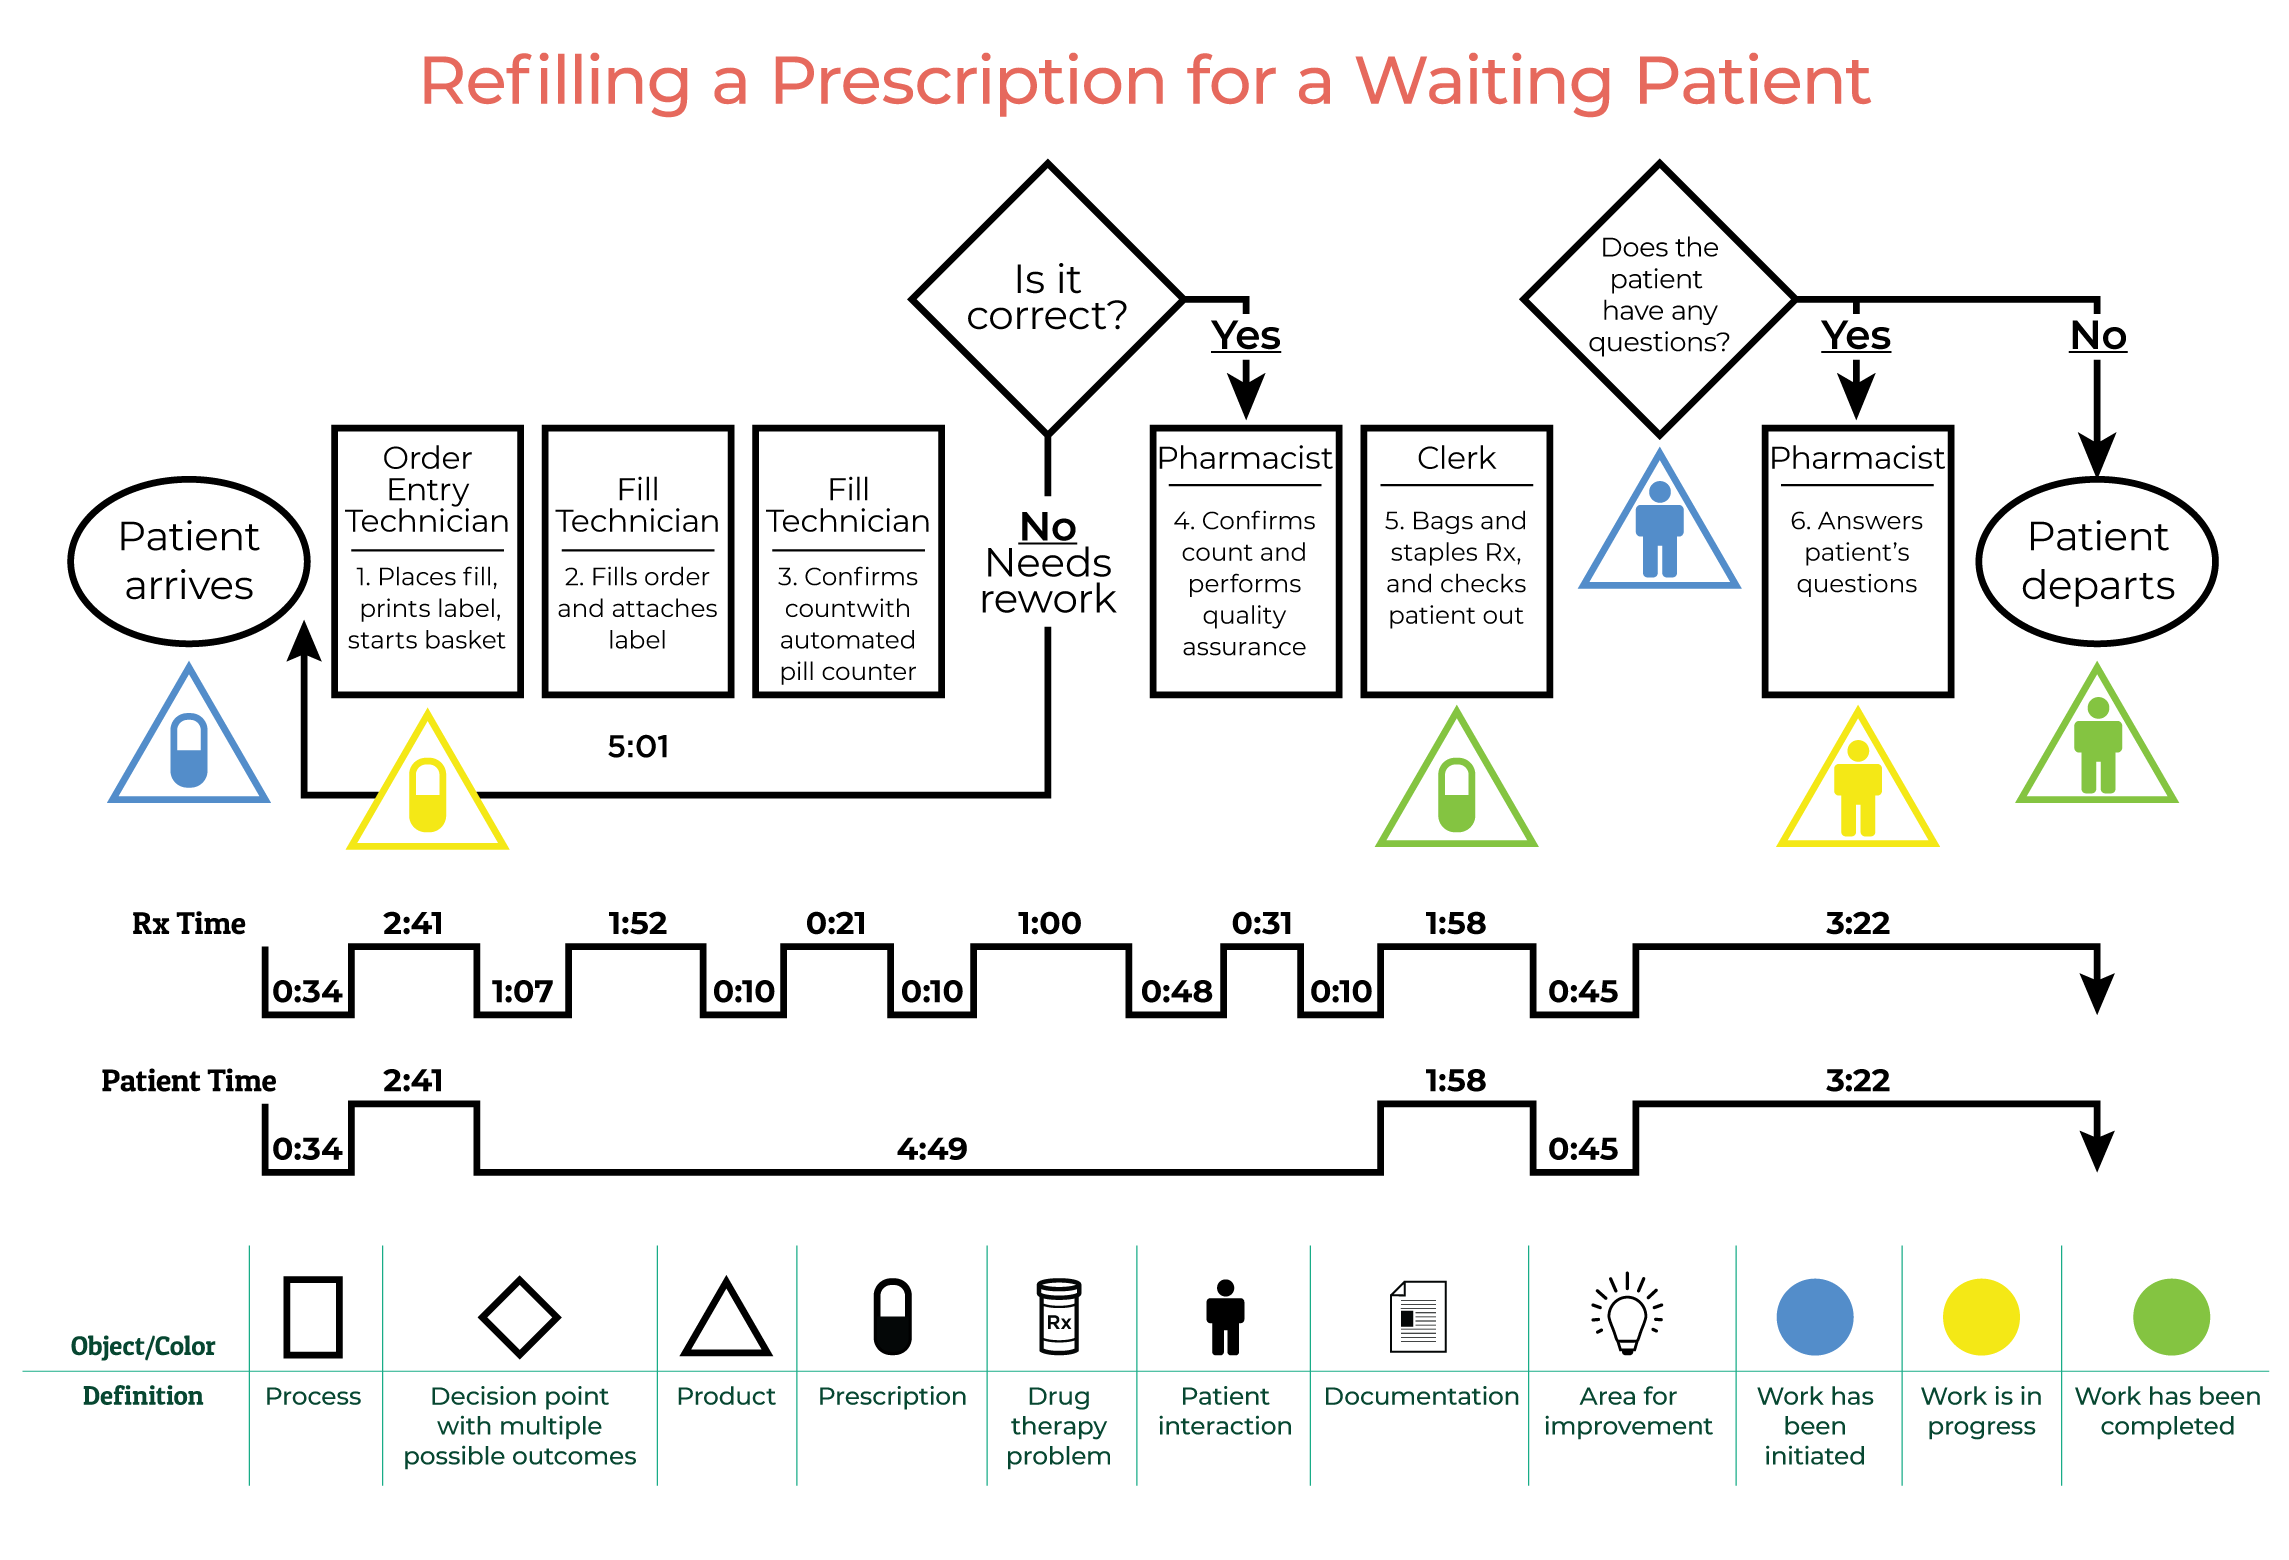
Notice that two “value streams” have been inserted below the diagram. A value stream identifies the times associated with tasks. Peaks correspond to value added times, and valleys show non-value added times.
The first value stream relates to “prescription time,” which is the time a prescription spends within the system. The second one corresponds to “patient time,” which is the time that a patient spends in the system. The numbers associated with these measurements are identified in the table below.
Prescription Time vs. Patient Time
| Prescription (Rx) Time | Patient Time |
| % Value Added = 78.9% | % Value Added = 57.7% |
| % Non-value Added = 21.1% | % Non-value Added = 42.3% |
To calculate the amount of time devoted to value added and non-value added tasks for the prescription time:
- Figure out the total amount of time spent on a task. This number should include value-added and non-value added time.
- Take the total amount of time spent on value added tasks (9.85) and divide it by the total amount of time spent on a task (12.49).
9.85 / 12.49 = 78.9% (percentage of time spent on value added tasks)
- Take the total amount of time spent on non-value added tasks (2.64) and divide it by the total amount of time spent on a task (12.49).
2.64 / 12.49 = 21.1% (percentage of time spent on non-value added tasks)
| Value Added Rx Time | Non-value Added Rx Time |
| 2.41 | 0.34 |
| 1.52 | 1.07 |
| 0.21 | 0.48 |
| 0.31 | 0.1 |
| 0.6 | 0.1 |
| 1.58 | 0.1 |
| 3.22 | 0.45 |
9.85 | 2.64 |
9.85 + 2.64 = 12.49 (total amount of time)
This pharmacy spends 21.1% of its time on non-value added tasks during the prescription refilling process. These tasks can likely be made more efficient, thereby reducing the total amount of time spent on refilling prescriptions and freeing up time within the pharmacy to work on other tasks.
Follow a similar process to calculate percentages for patient time.
Determining if an action is value added or non-value added depends upon whether you are the patient or the prescription. For example, when a prescription is being refilled and the patient is waiting, the action is value added for the prescription (because it is getting filled), but it is non-value added for the patient (because the patient has to wait).
It can be informative to calculate the percentage of time that is spent on value added versus non-value added tasks. With this information, your organization can identify processes that take too much time and need to be more efficient.
Determining Value
Check Your Knowledge
Question Four
The manager of the ReallyRight pharmacy is curious about the operations of her organization. She is particularly interested in ensuring that her marketing budget is used wisely. A value stream map will help her uncover this information.
Question Five
Sometimes patients at the ReallyRight Pharmacy call in their prescriptions, but they then fail to pick up their medication. Pharmacy technicians spend part of their day returning these items to inventory. What type of action is this?
Lesson Progress
Quality Improvement
Value stream mapping supports quality improvement, which is a formal approach used to improve processes within an organization. A number of quality improvement approaches are available, such as Lean Manufacturing, Six Sigma, or the Plan-Do-Study-Act Cycle.
The ways in which value stream mapping support quality improvement are explained below.
Identifying waste
One of the ways in which value steam mapping can support quality improvement efforts is by identifying areas of waste within an organization.4 Several types of waste are common in pharmacies, including inventory or product, motion, time, and processing.
Types of Waste in Organizations

Having more inventory or product on hand than is necessary, such as ordering too much of a medication and having to return it to a wholesaler.

Unnecessary steps or movement throughout the day that lead to inefficiencies. For example, if the layout of a pharmacy requires staff to run across the store to pick up medication for a prescription refill, there is unnecessary motion that creates inefficiency.

Time spent waiting on a service or action to be performed, or idle time when pharmacy staff and equipment are not being used. For example, if too many employees are working on a shift, there may be idle time when staff is not used efficiently.

Performing processes or operations that may be unnecessary. For example, a pharmacy without a medication synchronization process might have the same patient visit the pharmacy multiple times for multiple prescriptions within a short timeframe.
Identifying the root cause of inefficiencies
Value stream mapping can also be used to identify the root cause of inefficiencies or problems within an organization, which is a key component of quality improvement.
Quality improvement approaches often start with defining and measuring a problem or inefficiency, and then analyzing that problem to figure out its root causes.6 An example of a quality improvement approach is the DMAIC process developed by Six Sigma. This process is divided into five stages: define, measure, analyze, improve, and control.
DMAIC Process

Define

Measure
Analyze
Improve
Control
Value stream mapping is typically performed during the Analyze phase, where it is used to both visualize and analyze the waste in a system to identify root causes of a problem.
Consider this example. After completing a value stream map, you might realize that it takes your pharmacy 14 minutes to refill a prescription, which is much too long. By creating a value stream map, you realize that it is taking an excessive amount of time for your staff to fill orders because they have difficulty locating medications in the inventory cabinet. The value stream map identifies the problem (an inefficient prescription refill process) and it isolates the root cause of the problem (an unorganized inventory cabinet).
Identifying strategies to address the problem
Once a problem has been identified and analyzed, a pharmacy can brainstorm strategies to address the problem.
In the example above, if the medication inventory cabinet is unorganized, the pharmacy could test a new organization system and complete a future state value stream map (discussed in the Creating a Value Stream Map section below) after the new system has been implemented to determine if it reduces the amount of time it takes to refill a prescription.
Check Your Knowledge
Question Six
The manager of the ReallyRight Pharmacy is confident that there are inefficiencies in the organization’s processes. She decides to create a value stream map to identify areas where the pharmacy can minimize waste. What type of waste might be identified?
- Please select your answer.
- A) Lost sales/revenue
- B) Inefficient motion
- C) Ineffective advertising
- D) Problems with billing
Question Seven
Quality improvement approaches often start with defining and measuring a problem or inefficiency, and then analyzing that problem to figure out root causes. The DMAIC process is one approach that is commonly used, where “DMAIC” corresponds to Define, Measure, Analyze, Improve, and Control. Where in this process does value stream mapping usually occur?
Lesson Progress
Creating a Value Stream Map
Steps Involved in Creating a Value Stream Map
Identify a process you want to observe (e.g., refilling a prescription) and conduct observations of that process. As you observe, note each of the steps in the process and document how much time it takes to perform each step.
Map the process with relevant steps and identify the product produced by each step.
Determine which steps in a process are value added and which are non-value added.
Target non-value added areas for possible improvements.
Create a future state map that incorporates suggested improvements.
Creating a value stream map is a multi-step process, as described in the graphic above. The remainder of this lesson walks you through each of these steps, using the comprehensive medication review (CMR) process as an example.
A CMR is commonly defined as:
“A systematic process of collecting patient-specific information, assessing medication therapies to identify drug therapy problems (DTPs), developing a prioritized list of DTPs, and creating a plan to resolve them with the patient, caregiver, or prescriber.” 7
Observe a process
The first step in creating a value stream map is identifying:
- The steps of a process
- The duration of each step
Begin by designating a staff member to create the value stream map. This person should ideally be an outside observer who will not play a role in the process being evaluated. (“Outside observer” does not mean someone outside the organization; it merely means someone outside of the process.)

It is not always feasible to have a dedicated observer. In those situations, staff members should discuss the general flow of the process, and then each staff member should conduct his/her own time study. Staff members should record the starting and ending times for each step in the process, repeating the steps a number of times to identify the average amount of time each one takes.
It is important to measure time at different points in the day. Consider the following questions to determine when measurements should be made:
- Does demand† differ between the morning and the afternoon?
- Does demand† differ on different days of the week?
- Does the pharmacy have different staffing configurations on different days?
- Do different staff members have different capabilities that affect their role in the process?
†"Demand” is anything that triggers an event to be completed in a process. If you create a value stream map of refilling a prescription, for example, an example of demand is the arrival of patients. If you are making a value stream map of a comprehensive medication review, an example of demand is a patient needing a CMR.1
Once you have completed the observations and time studies for a process, use standard data collection forms to ensure that each staff member collects the same data. An example of a data collection form is shown below.
Data Collection Form for Process Observations
Click Display to see a completed form.
| Observation No. | Your Rating (%) | Observation Time (minute) | Standard Time (minute) | Actual Rating (%) | Difference |
- A performance rating (signified by “Your rating (%)" in this chart) is a multiplier that assesses how quickly work is performed above normal. For example, if technicians fill prescriptions more quickly than normal, they might have a performance rating of 120%, and the standard time will be 1.2 observed time. If they perform slowly, a performance rating of 80% might be more appropriate. Sometimes performance ratings are not feasible, such as when staff members are timing themselves, and in these instances, only observation times are used.
- The observation time is the amount of observed time it takes for a task to be completed.
- The standard time is the amount of time it typically takes to perform a task. You can find out the standard time for a given task by either asking other pharmacies for estimates or by doing research online to determine how long it typically takes pharmacies to perform the task.
Example: Conducting a comprehensive medication review
Data is collected on the following actions:
- Print list of patients eligible for CMR.
- Identify patients at risk for DTPs and print fill histories.
- Write date of birth (DOB) and last CMR date on printed fill histories.
- Call patient and document attempt to reach patient.
- Conduct CMR on phone and take notes by hand.
- Document CMR, updated medication list, and DTPS.
- Review technician documentation and approve.
- Contact prescriber about DTPs and document attempt to contact prescriber.
Create a basic flow map
To create a basic flow map of a process, divide the process into a series of general steps. When identifying steps, focus on either: 1) when the process changes from one staff member to another, or 2) whenever wait time exists between one step and the next.
The basic flow map should answer the following questions about a process:
- Which action triggers another action?
- Who performs each step in the process?
- Where do hand-offs from one staff-member to another happen?
If any of these questions cannot be answered, the process observations may need to be repeated. It is important for each staff member to agree that the flow accurately represents the process.
The shapes used to create a flow map have agreed-upon meanings, so it is important to use the correct shapes at designated points in the map. Refer to the legend in the example below for a review of the meanings of the shapes.
Example: Conducting a comprehensive medication review
The basic flow of the value stream map for conducting a comprehensive medication review is provided below.
Notice that this map does not have a value stream or any times associated with it. Also, notice that the triangles identify steps involving product. The triangles are color coded based upon whether they have been initiated (blue), are in progress (yellow), or are completed (green).
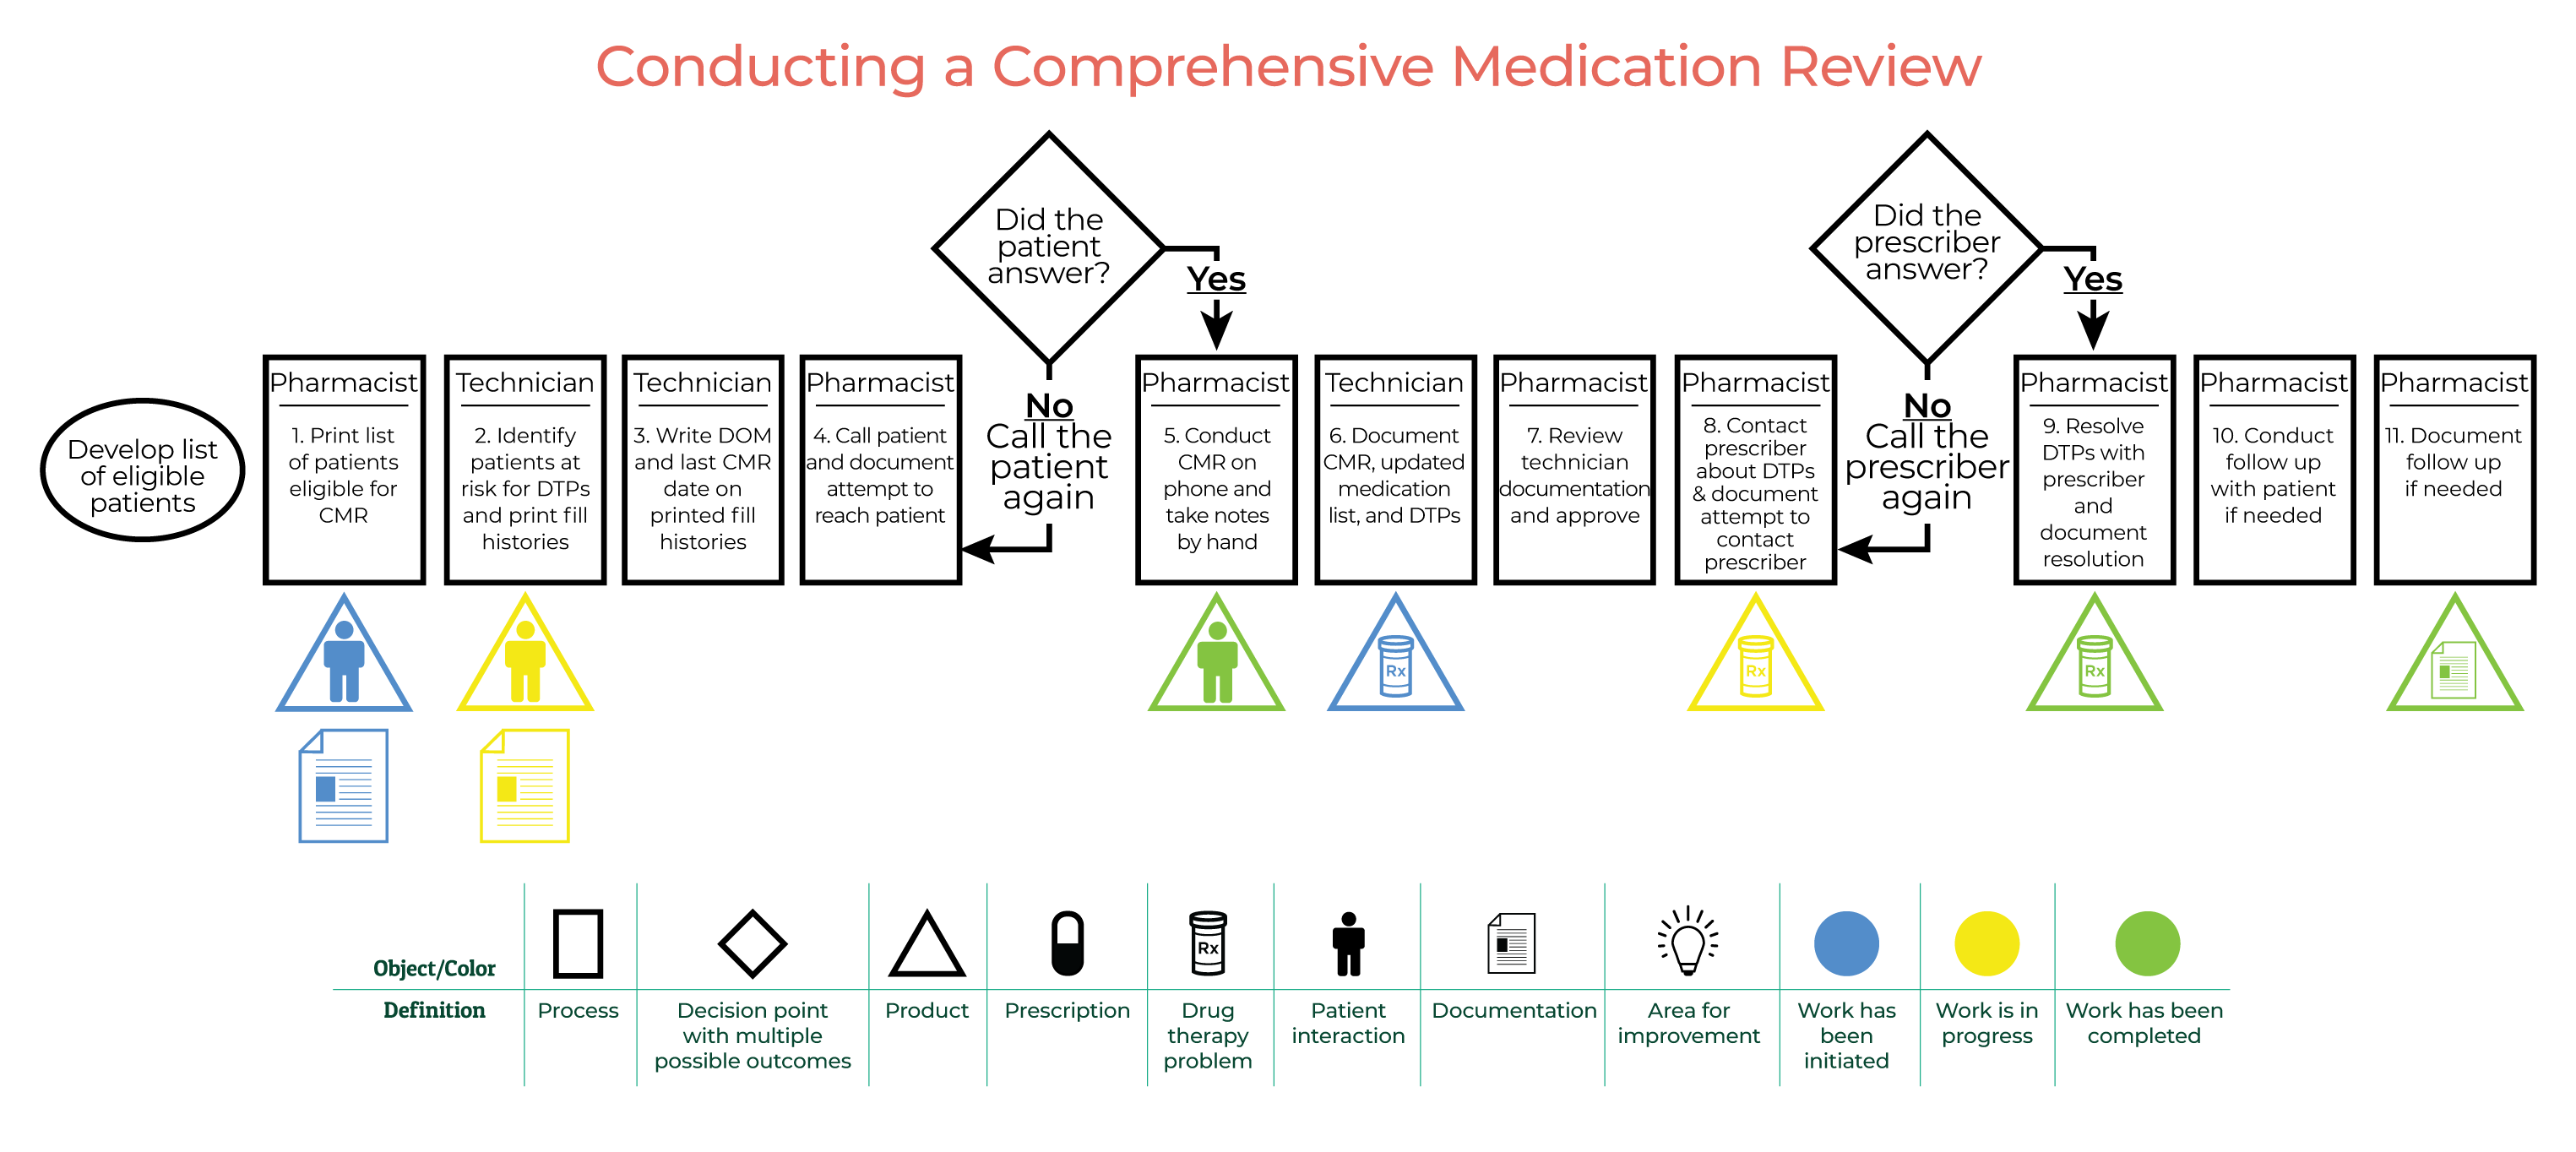
The basic flow maps above (and the value stream maps appearing in later parts of the lesson) were made using Microsoft Visio.
Maps can also be made by hand or by using other software that supports the creation of shapes and lines (such as PowerPoint, Word, etc.).
Specialized software or add-ins (Lucidchart official, VSM Chart Free, Edraw Soft, etc.) are also available, as is a free Excel template.9
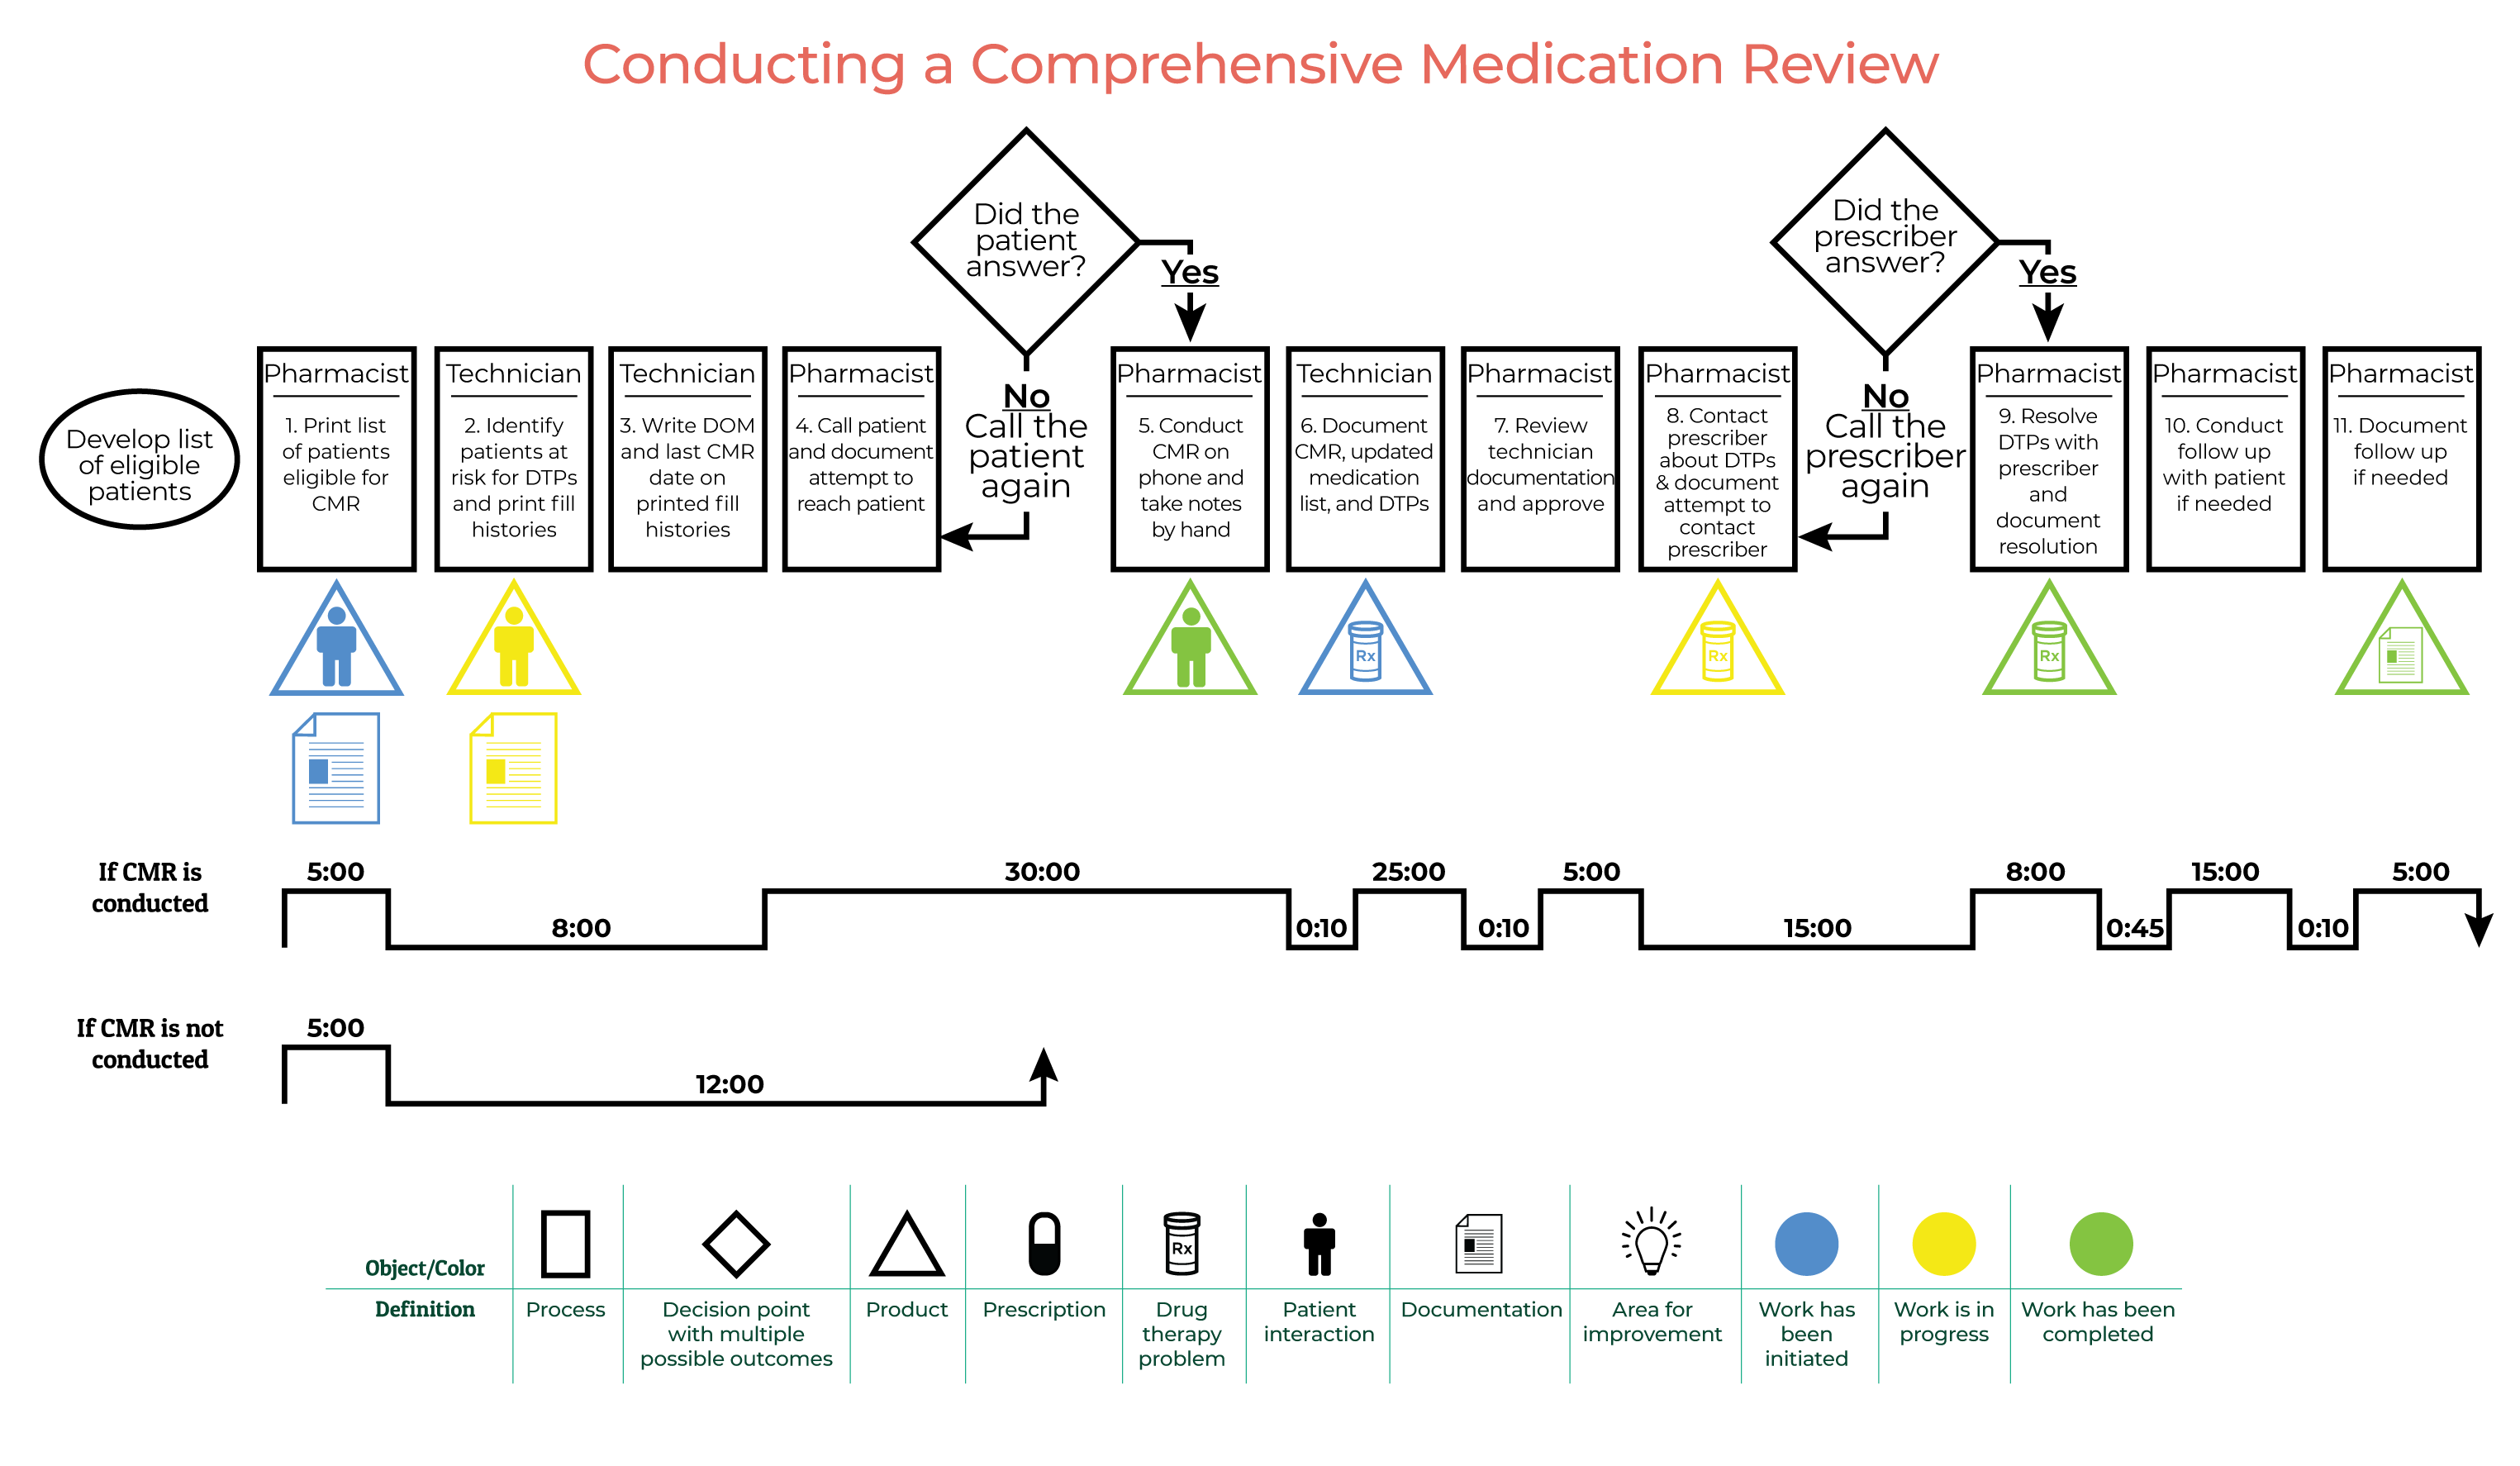
Add time data and a value stream
An important part of creating a value stream map is to determine which steps in a process are value added and which steps are non-value added. It is then possible to calculate the percentage of value added and non-value added time that is present in a process, with the goal of targeting non-value added actions for potential improvements.
As a general guideline, value added actions improve patient care in some way. Value added actions are also actions that do not produce waste. (Remember that there are four general types of waste in organizations: product/inventory, motion, time, and processing.)
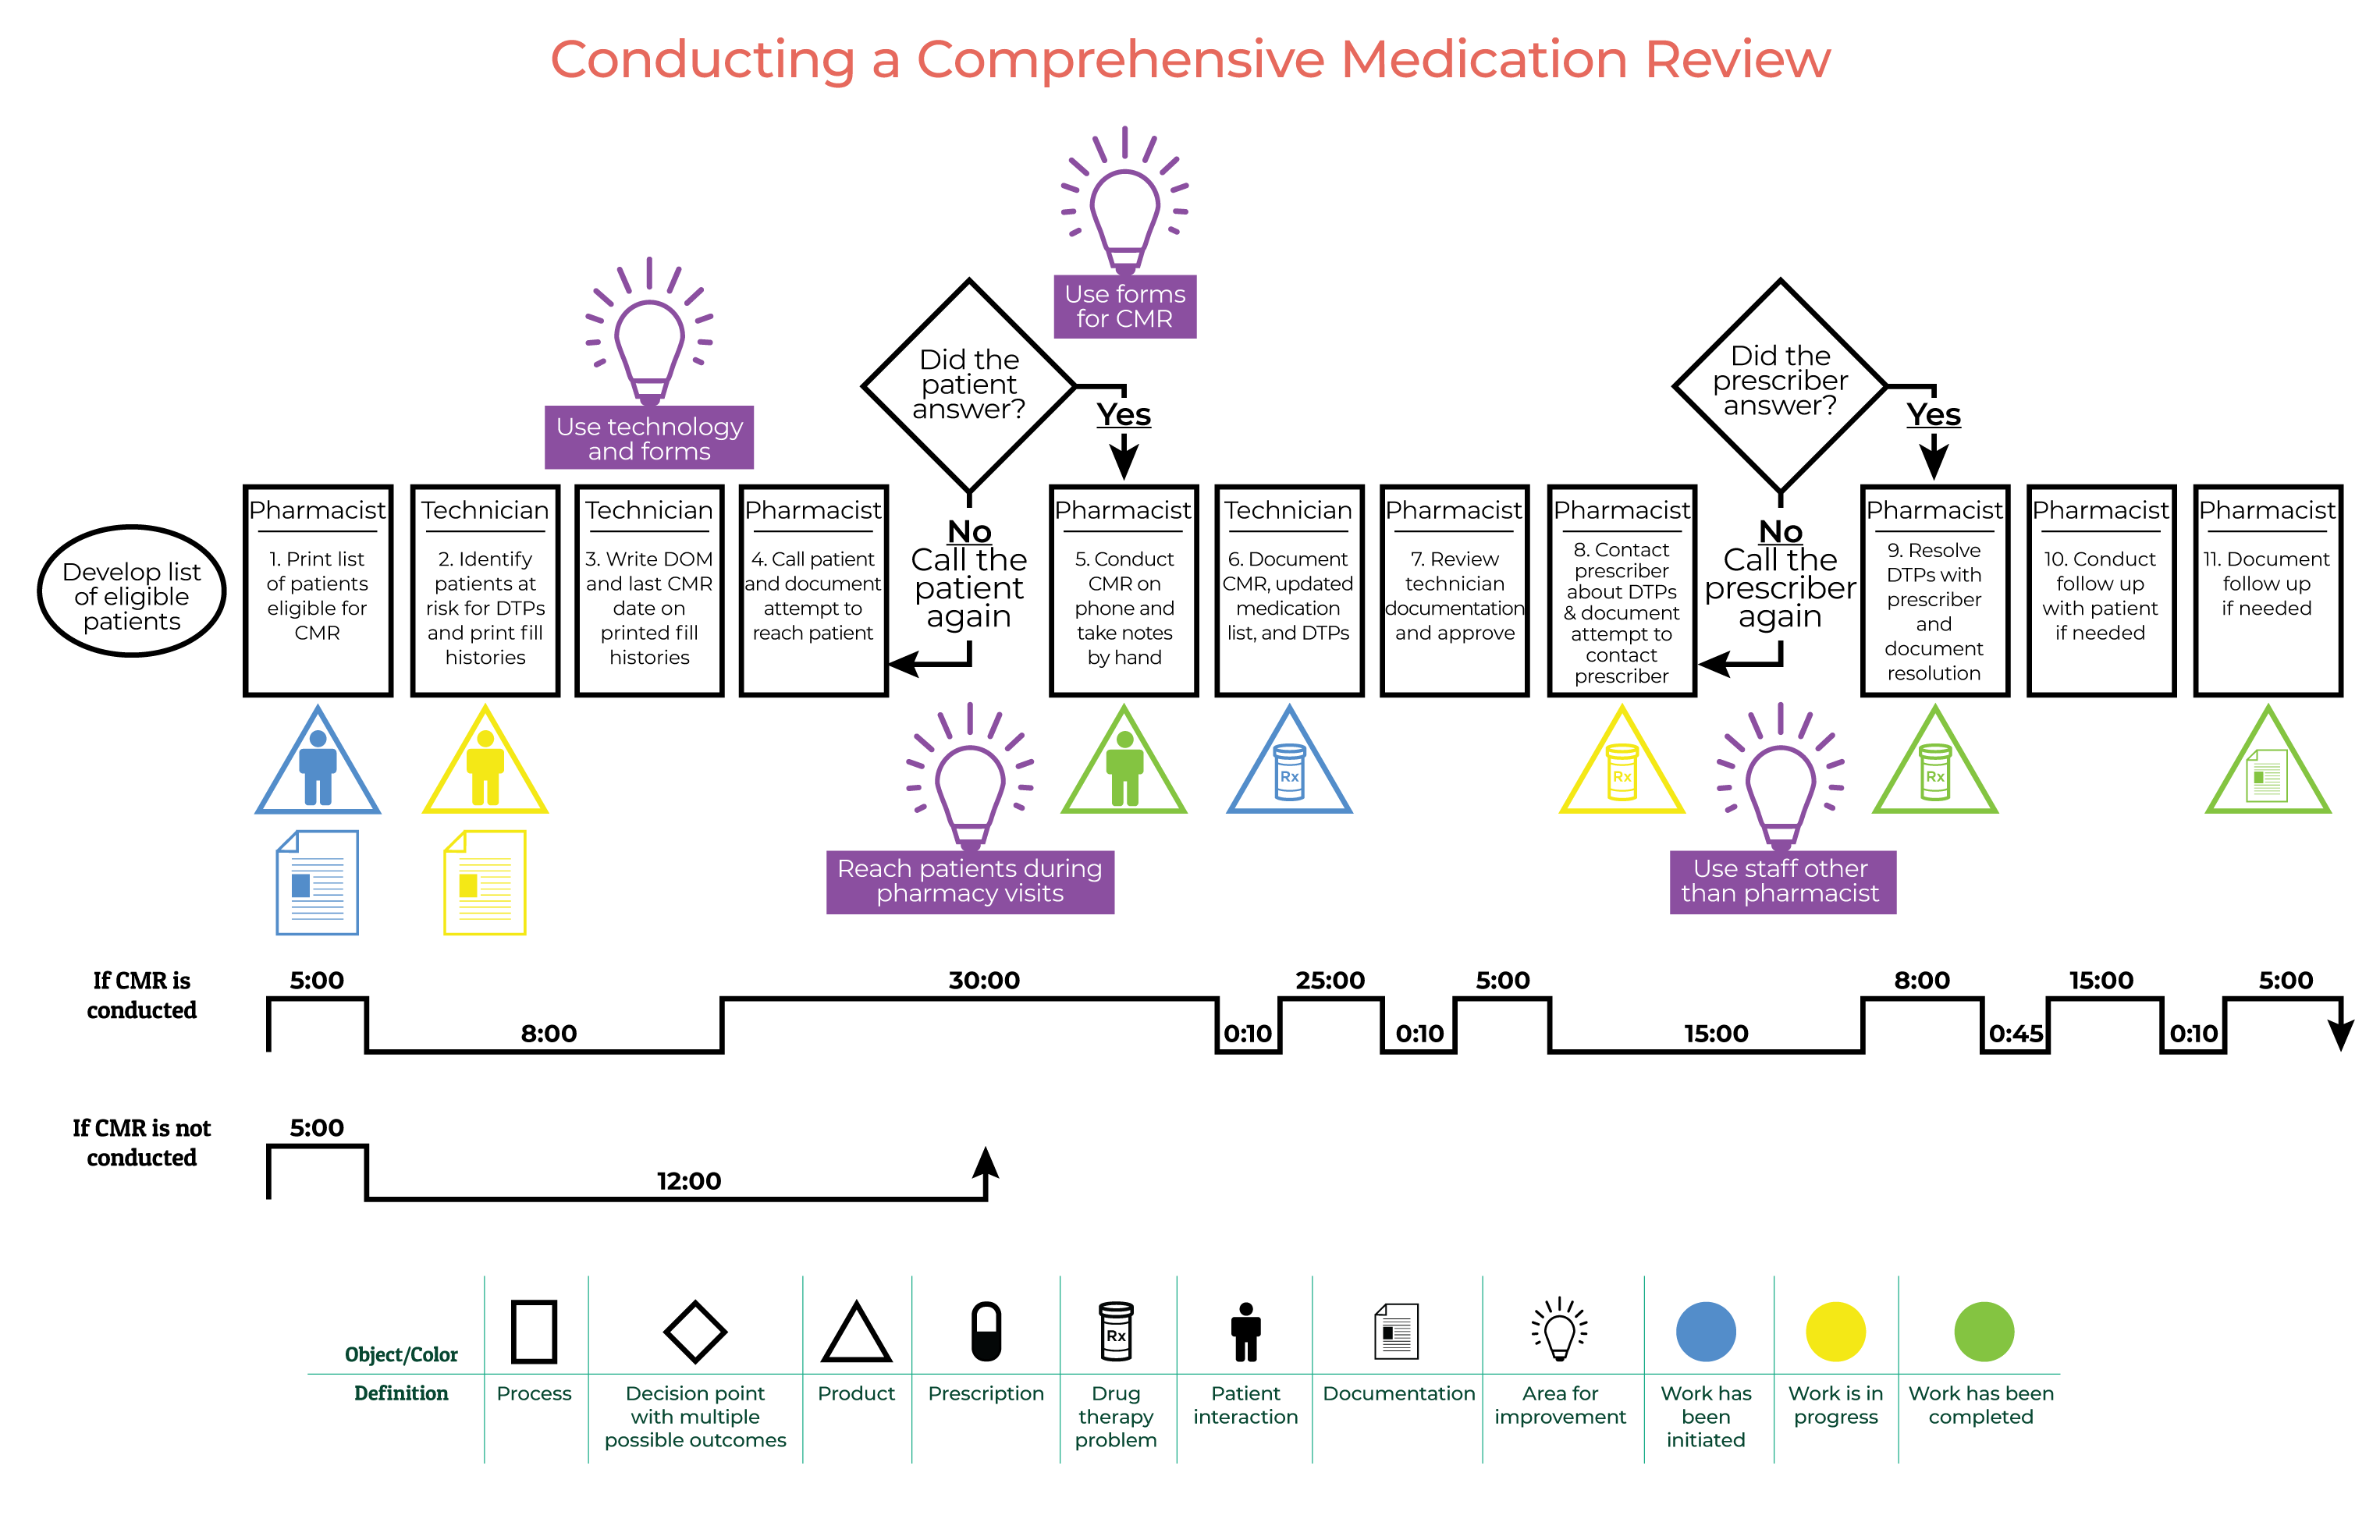
Add improvement areas
One of the goals of using value stream mapping as a process improvement tool is to identify the areas of a process that can be improved. A good guideline is to target non-value added time.
While it is impossible to eliminate all non-value added time, the goal is to reduce it is much as possible. Reductions can be achieved by rearranging the steps of a process, eliminating unnecessary steps, reassigning roles, etc.
Example: Conducting a comprehensive medication review
The following actions were determined to be non-value added for this example:
- Any wait times between actions.
- The time spent sorting the list of patients eligible for a CMR and writing their date of birth (DOBs) on a form, because this could be done with a pre-formatted list and form.
- The time spent performing pre-work and trying to contact a patient who never answers the phone.
- The time a pharmacist spends trying to contact a prescriber for follow up.
Percentage of Value Added and Non-Value Added Time
| If CMR is conducted | If CMR is not conducted |
| % Value Added = 79.7% | % Value Added = 29.4% |
| % Non-Value Added = 20,3% | % Non-value Added = 70.6% |
A light bulb in a value stream map represents an area for improvement or a step that can be made more efficient. In the CMR process represented below, for example, the pharmacist originally made calls to prescribers about DTPs. This step could be made more efficient by having a pharmacy technician complete the calls. Therefore, this step is flagged as an area for improvement.
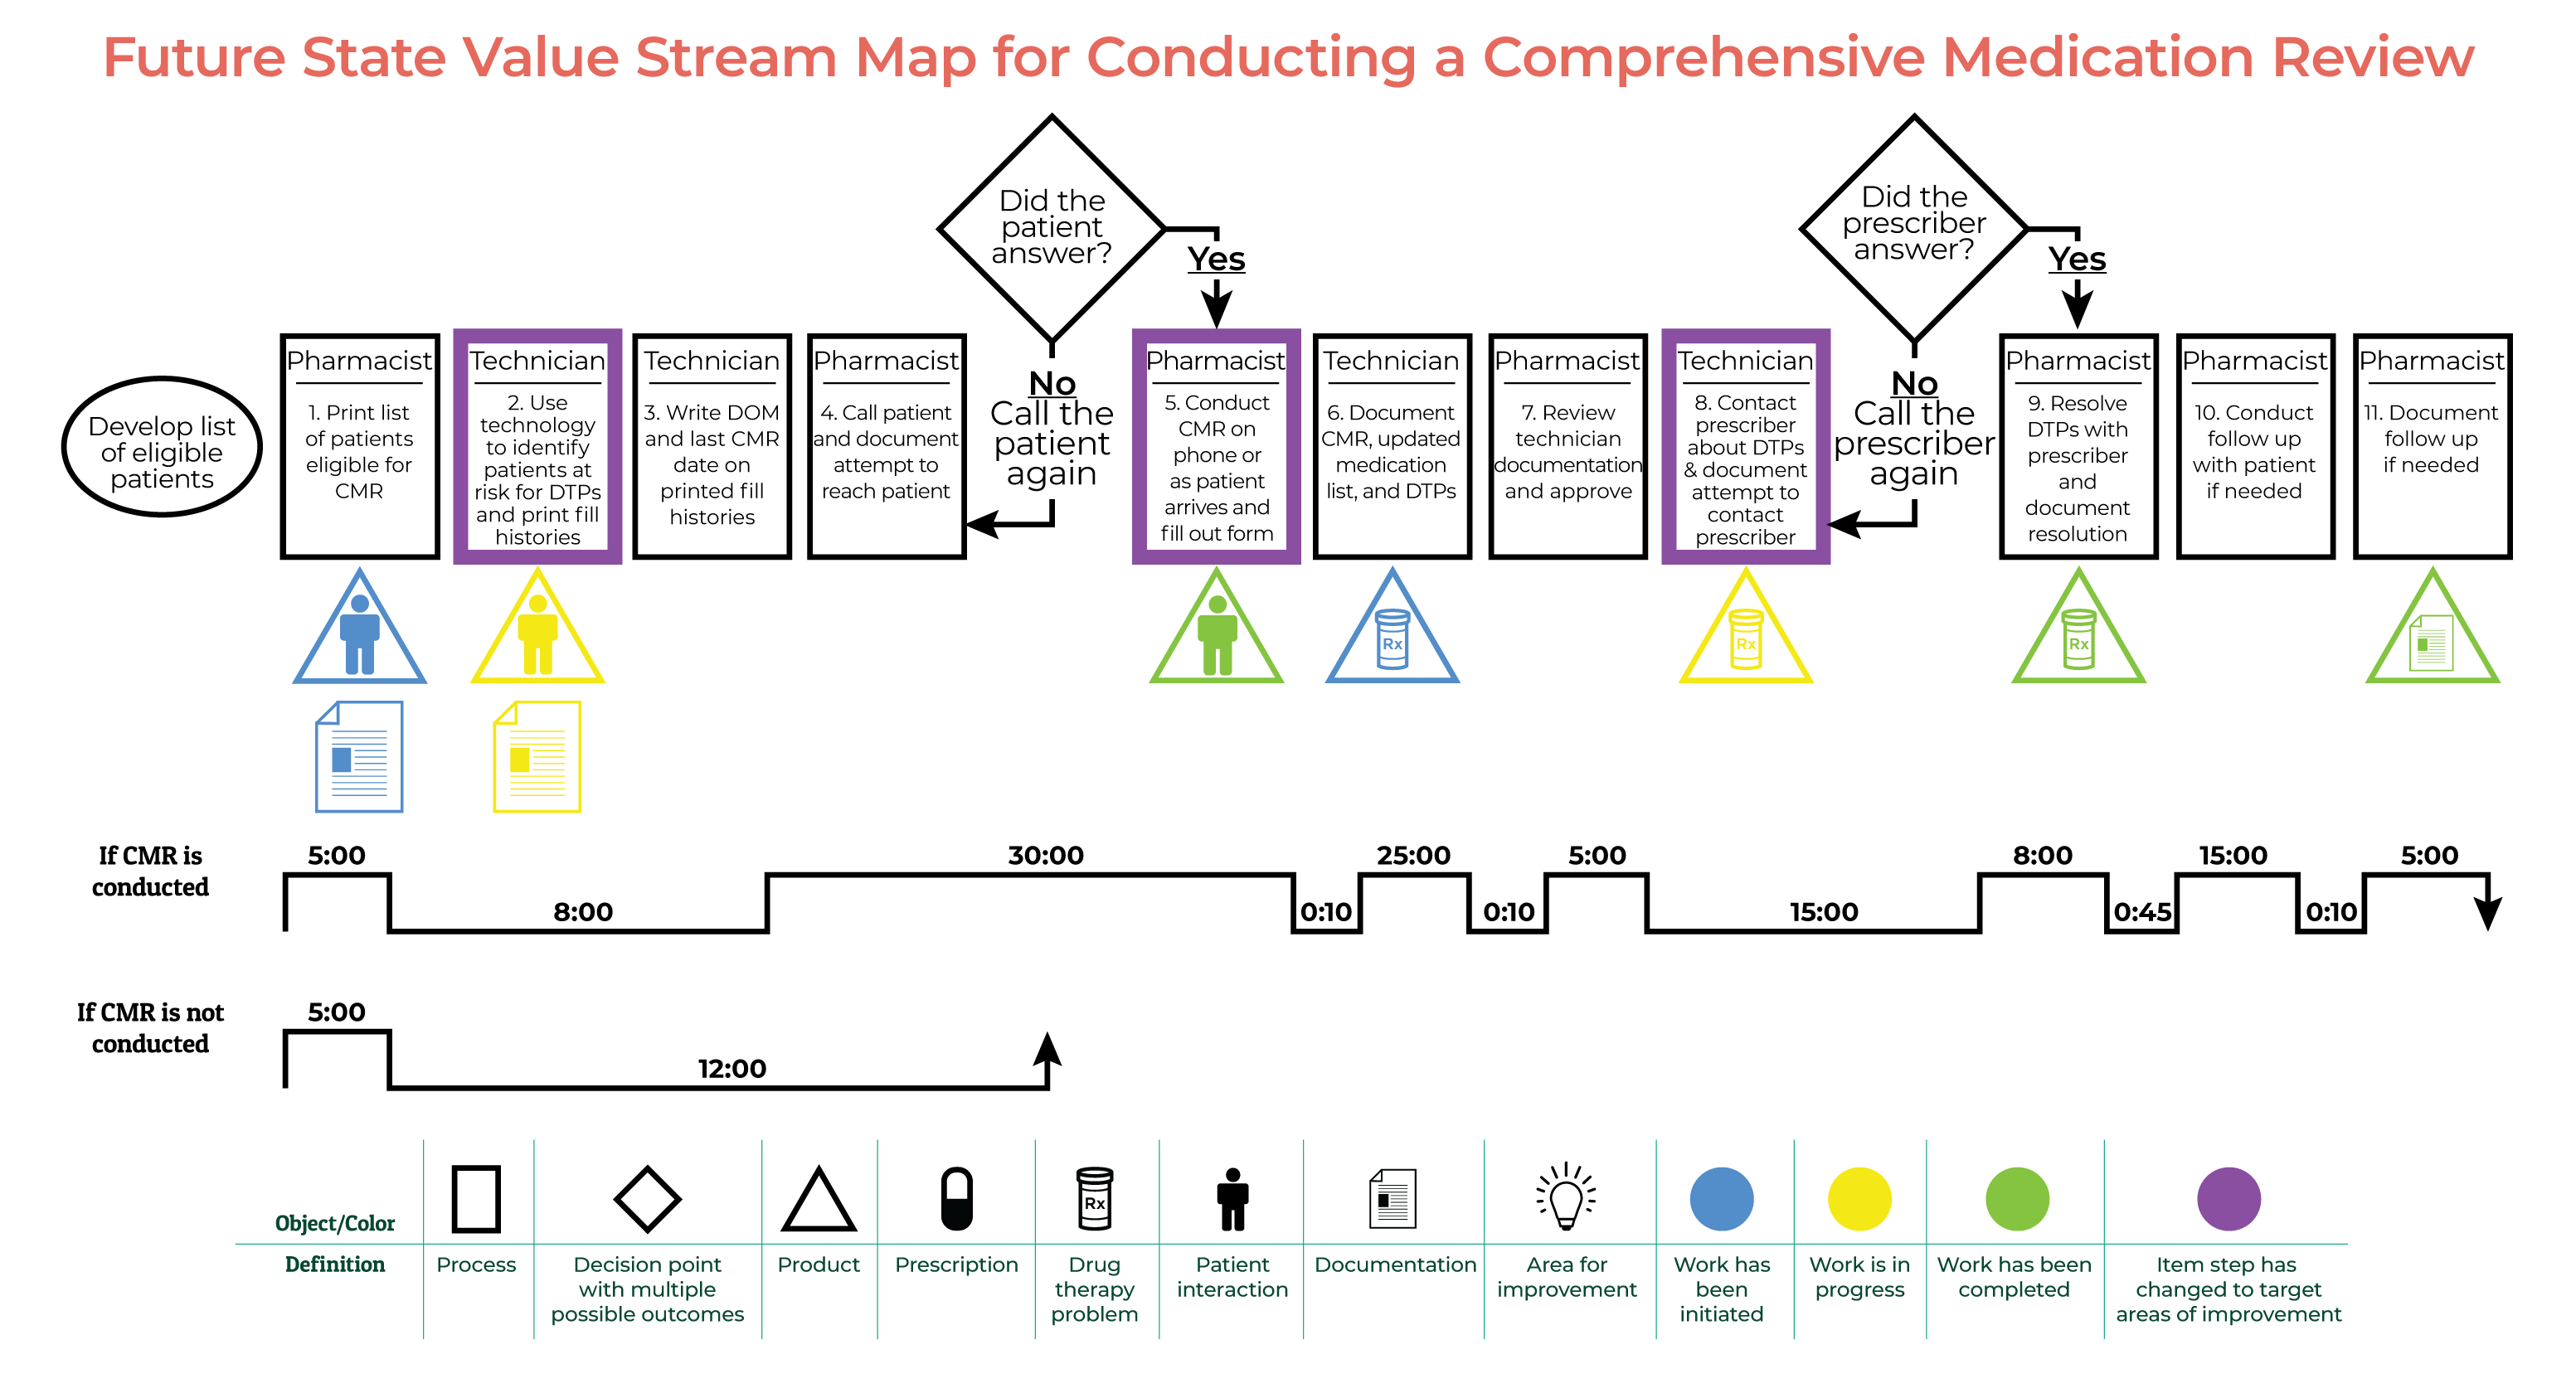
Future state value stream mapping
Before implementing any changes identified during the value stream mapping process, it is important to also create a future state value stream map that incorporates the proposed changes.
A future state value stream map creates a visual representation of the changed flow and is helpful in hypothesizing about how the changes will affect the time spent on different actions.
Future state value stream maps can be used to detect potential barriers prior to implementation.
Lesson Progress
Key Takeaways
- Value stream mapping can be a useful tool to help visualize processes in your pharmacy and identify target areas for improvement.
- Once areas of improvement have been identified, your team can discuss strategies for improving efficiency and use future state value stream mapping to visualize how those improvement strategies can be incorporated into your pharmacy’s workflow.
References
- Lucid Chart. What is value stream mapping? 2018; https://www.lucidchart.com/pages/value-stream-mapping. Accessed April 30, 2018.
- Graphic Products. Value added versus non-value added activities. 2018; https://www.graphicproducts.com/articles/value-added-vs-non-value-added-activities/ . Accessed April 30, 2018.
- Porter ME. What is value in health care? N Engl J Med. 2010;363(26):2477-2481. http://dx.doi.org/10.1056/NEJMp1011024. doi: 10.1056/NEJMp1011024.
- Lean Enterprise Institute. Toyota Production System. 2018; https://www.lean.org/lexicon/toyota-production-system. Accessed April 30, 2018.
- Virginia Mason Institute. Identifying the seven wastes to build a lean foundation. 2016; https://www.virginiamasoninstitute.org/2016/06/identifying-the-seven-wastes-to-build-a-lean-foundation/. Accessed April 30, 2018.
- Go LeanSixSigma.com. DMAIC: The five phases of lean six sigma. 2018; https://goleansixsigma.com/dmaic-five-basic-phases-of-lean-six-sigma/ . Accessed April 30, 2018.
- Pharmacy Times. MTM advisory board updates definition of key pharmacist service. 2011; https://www.pharmacytimes.com/news/mtm-advisory-board-updates-definition-of-key-pharmacist-service. Accessed July 3, 2018.
- Industrial Engineering Lab. Work Study Equipment. 2011; http://industrialengineeringlabutm.blogspot.com/2011/01/work-study-equipment.html. Accessed April 30, 2018.
- Lean Enterprise Institute. Value Stream Mapping Template. 2018; https://www.lean.org/FuseTalk/Forum/Attachments/Value%20Stream%20VSM%20Template.xls . Accessed April 30, 2018.
Citation
Smith, K., Renfro, C., Turner, K., & Ivy, J. (2018). Value stream mapping. Chapel Hill, NC: UNC Center for Medication Optimization. Retrieved from: https://wp.media.unc.edu/changemgmt/valuestream