Terms that appear frequently throughout this lesson are defined below:
| Term | Definition |
| Data quality | |
|
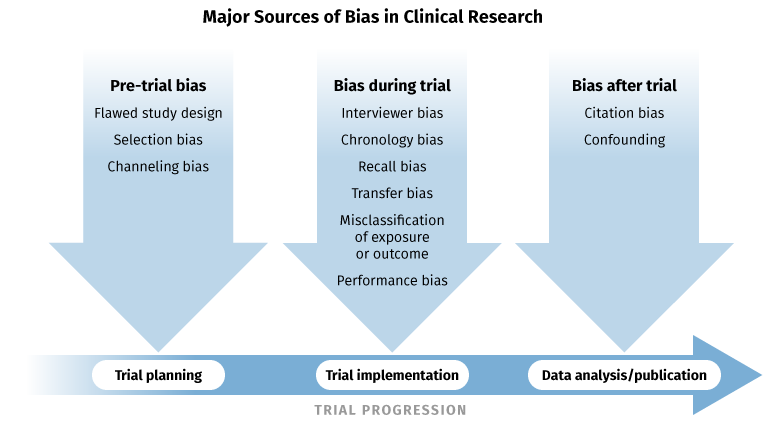
Bias |
Systematic error introduced by selecting or encouraging one outcome over others |
|
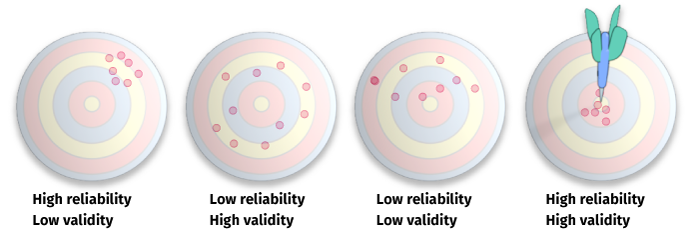
Validity |
Extent to which a measure actually represents what it claims to measure |
|
Reliability |
Degree to which results are stable and consistent |
|
Sensitivity |
Proportion of positives that are correctly identified |
|
Specificity |
Proportion of negatives that are correctly identified |
| Data relationships | |
|
Correlated |
A statistical relationship existing between two variables or datasets that reflects a dependence between the two |
|
Independent |
The occurrence of one variable does not influence the probability of another variable |
| Data parametrics | |
|
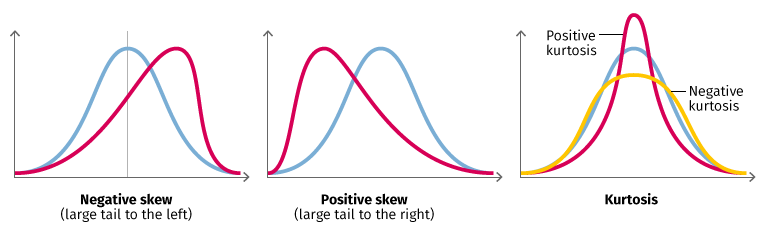
Parametric |
Data with an underlying normal distribution |
|
Nonparametric |
Data for which the probability distribution is unknown or known not to be normal |